
 Dr. G. O. C. Okwuibe
Battery Arbitrage Opportunity — Week 11, 2026
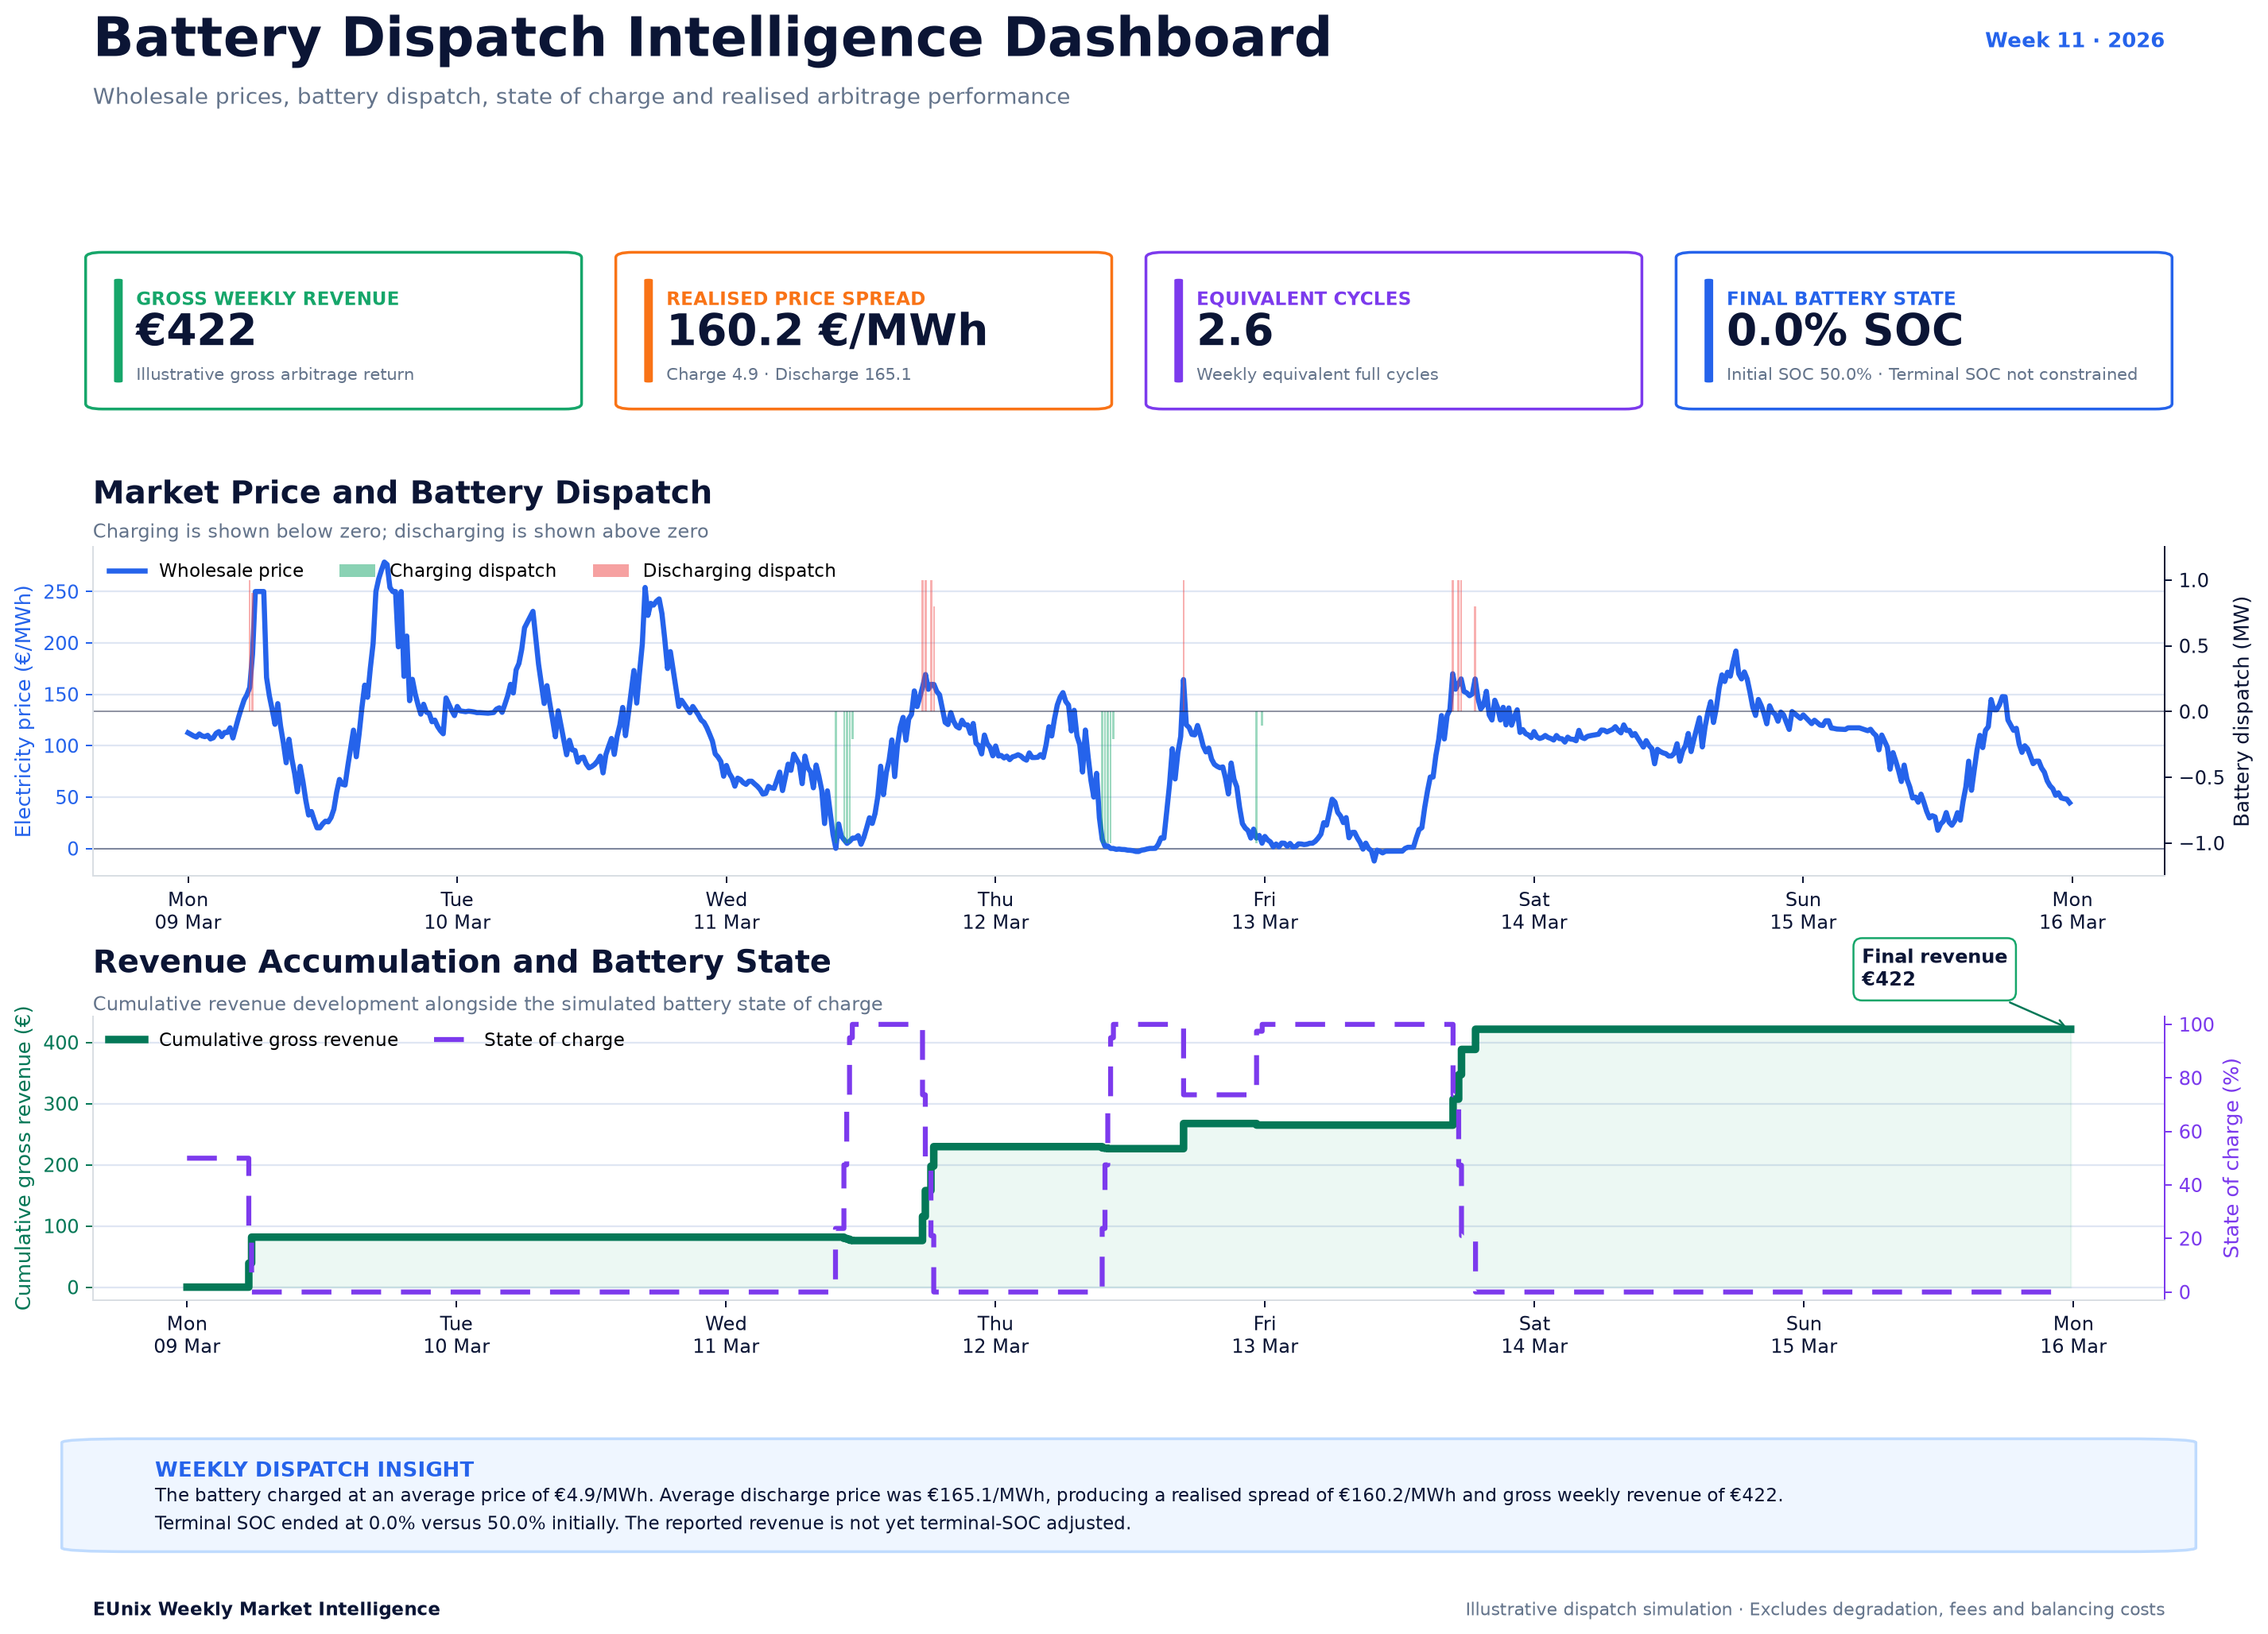
Large wholesale price swings created a strong battery-arbitrage environment in Germany during Week 11. EUnix Market Intelligence identified a maximum daily spread of €258.64/MWh, 34.25 strong opportunity hours, and negative-price periods during the week. An illustrative 1 MW / 1 MWh battery simulation produced €422 gross weekly arbitrage revenue, highlighting the commercial value of well-timed charging and discharging.
Charts
Market Overview
The story received a priority score of 91.61, supported by a very strong detection strength of 95.15% and confidence of 83.33%.
The dominant signal was a maximum daily arbitrage spread of €258.64/MWh, while approximately 34.25 hours were classified as strong charging or discharging opportunities.
The underlying price structure was particularly favourable for storage. Wholesale electricity prices reached a weekly maximum of approximately €278.7/MWh and fell as low as −€12.2/MWh, while the weekly average price was around €97.0/MWh.
The supporting analytics strongly reinforced the story. Battery opportunity scored 96.03, followed by price volatility at 75.74 and negative-price conditions at 65.53. Unlike some arbitrage weeks driven only by positive price variation, Week 11 also included periods when electricity prices fell below zero, creating especially attractive charging conditions.
Key Observations
Interpretation
The weekly price curve shows several distinct regimes. Early in the week, prices repeatedly climbed above €200/MWh before falling sharply. Later in the week, prices approached zero and briefly became negative before recovering above €150/MWh.
This combination created a particularly favourable environment for storage.
Negative-price periods strengthen battery economics because a battery can charge when the cost of electricity is exceptionally low. The stored energy can then be discharged during later periods when prices recover substantially.
However, the theoretical maximum spread of €258.64/MWh should not be confused with the spread that an actual battery can fully capture. Asset constraints determine how much of the theoretical opportunity becomes realisable.
The Week 11 simulation illustrates this distinction well. Although the maximum daily spread exceeded €250/MWh, the simulated battery realised an average charge-to-discharge spread of approximately €160.2/MWh.
State of charge, efficiency losses, power limits, energy capacity, timing and the availability of future price opportunities all influence dispatch decisions.
The battery therefore creates value not by responding to every individual price movement, but by selectively preserving capacity for the most attractive combinations of charging and discharging opportunities.
Revenue Insight
Market Outlook
If similar patterns continue, the value of short-duration battery storage could remain supported by recurring intraday spreads. Periods in which renewable production drives prices close to or below zero, followed by sharp evening or system-stress recoveries, are particularly attractive for arbitrage.
The key indicators to monitor in subsequent weeks are daily arbitrage spreads, negative-price duration, charging-window frequency, high-price discharge periods and the persistence of price volatility.
Battery operators should also monitor whether these energy-market opportunities coincide with attractive FCR, aFRR or other flexibility-market revenues. When standalone arbitrage spreads weaken, revenue stacking may become increasingly important.
The broader Week 11 message is clear: battery value depends not simply on electricity prices being high or low, but on the timing, magnitude and persistence of price differences — and on an asset's ability to respond optimally to them.
Simulation Note
Written by
Dr. G. O. C. Okwuibe
Quantitative Energy Systems Expert | Electricity Market & BESS
Dr. Godwin Okwuibe is a quantitative energy system expert specializing in electricity markets, battery storage optimization, and flexibility market design. His work focusses on translating complex market dynamics into actionable insights for industry stakehold...