
 Dr. G. O. C. Okwuibe
Battery Arbitrage Opportunity — Week 12, 2026
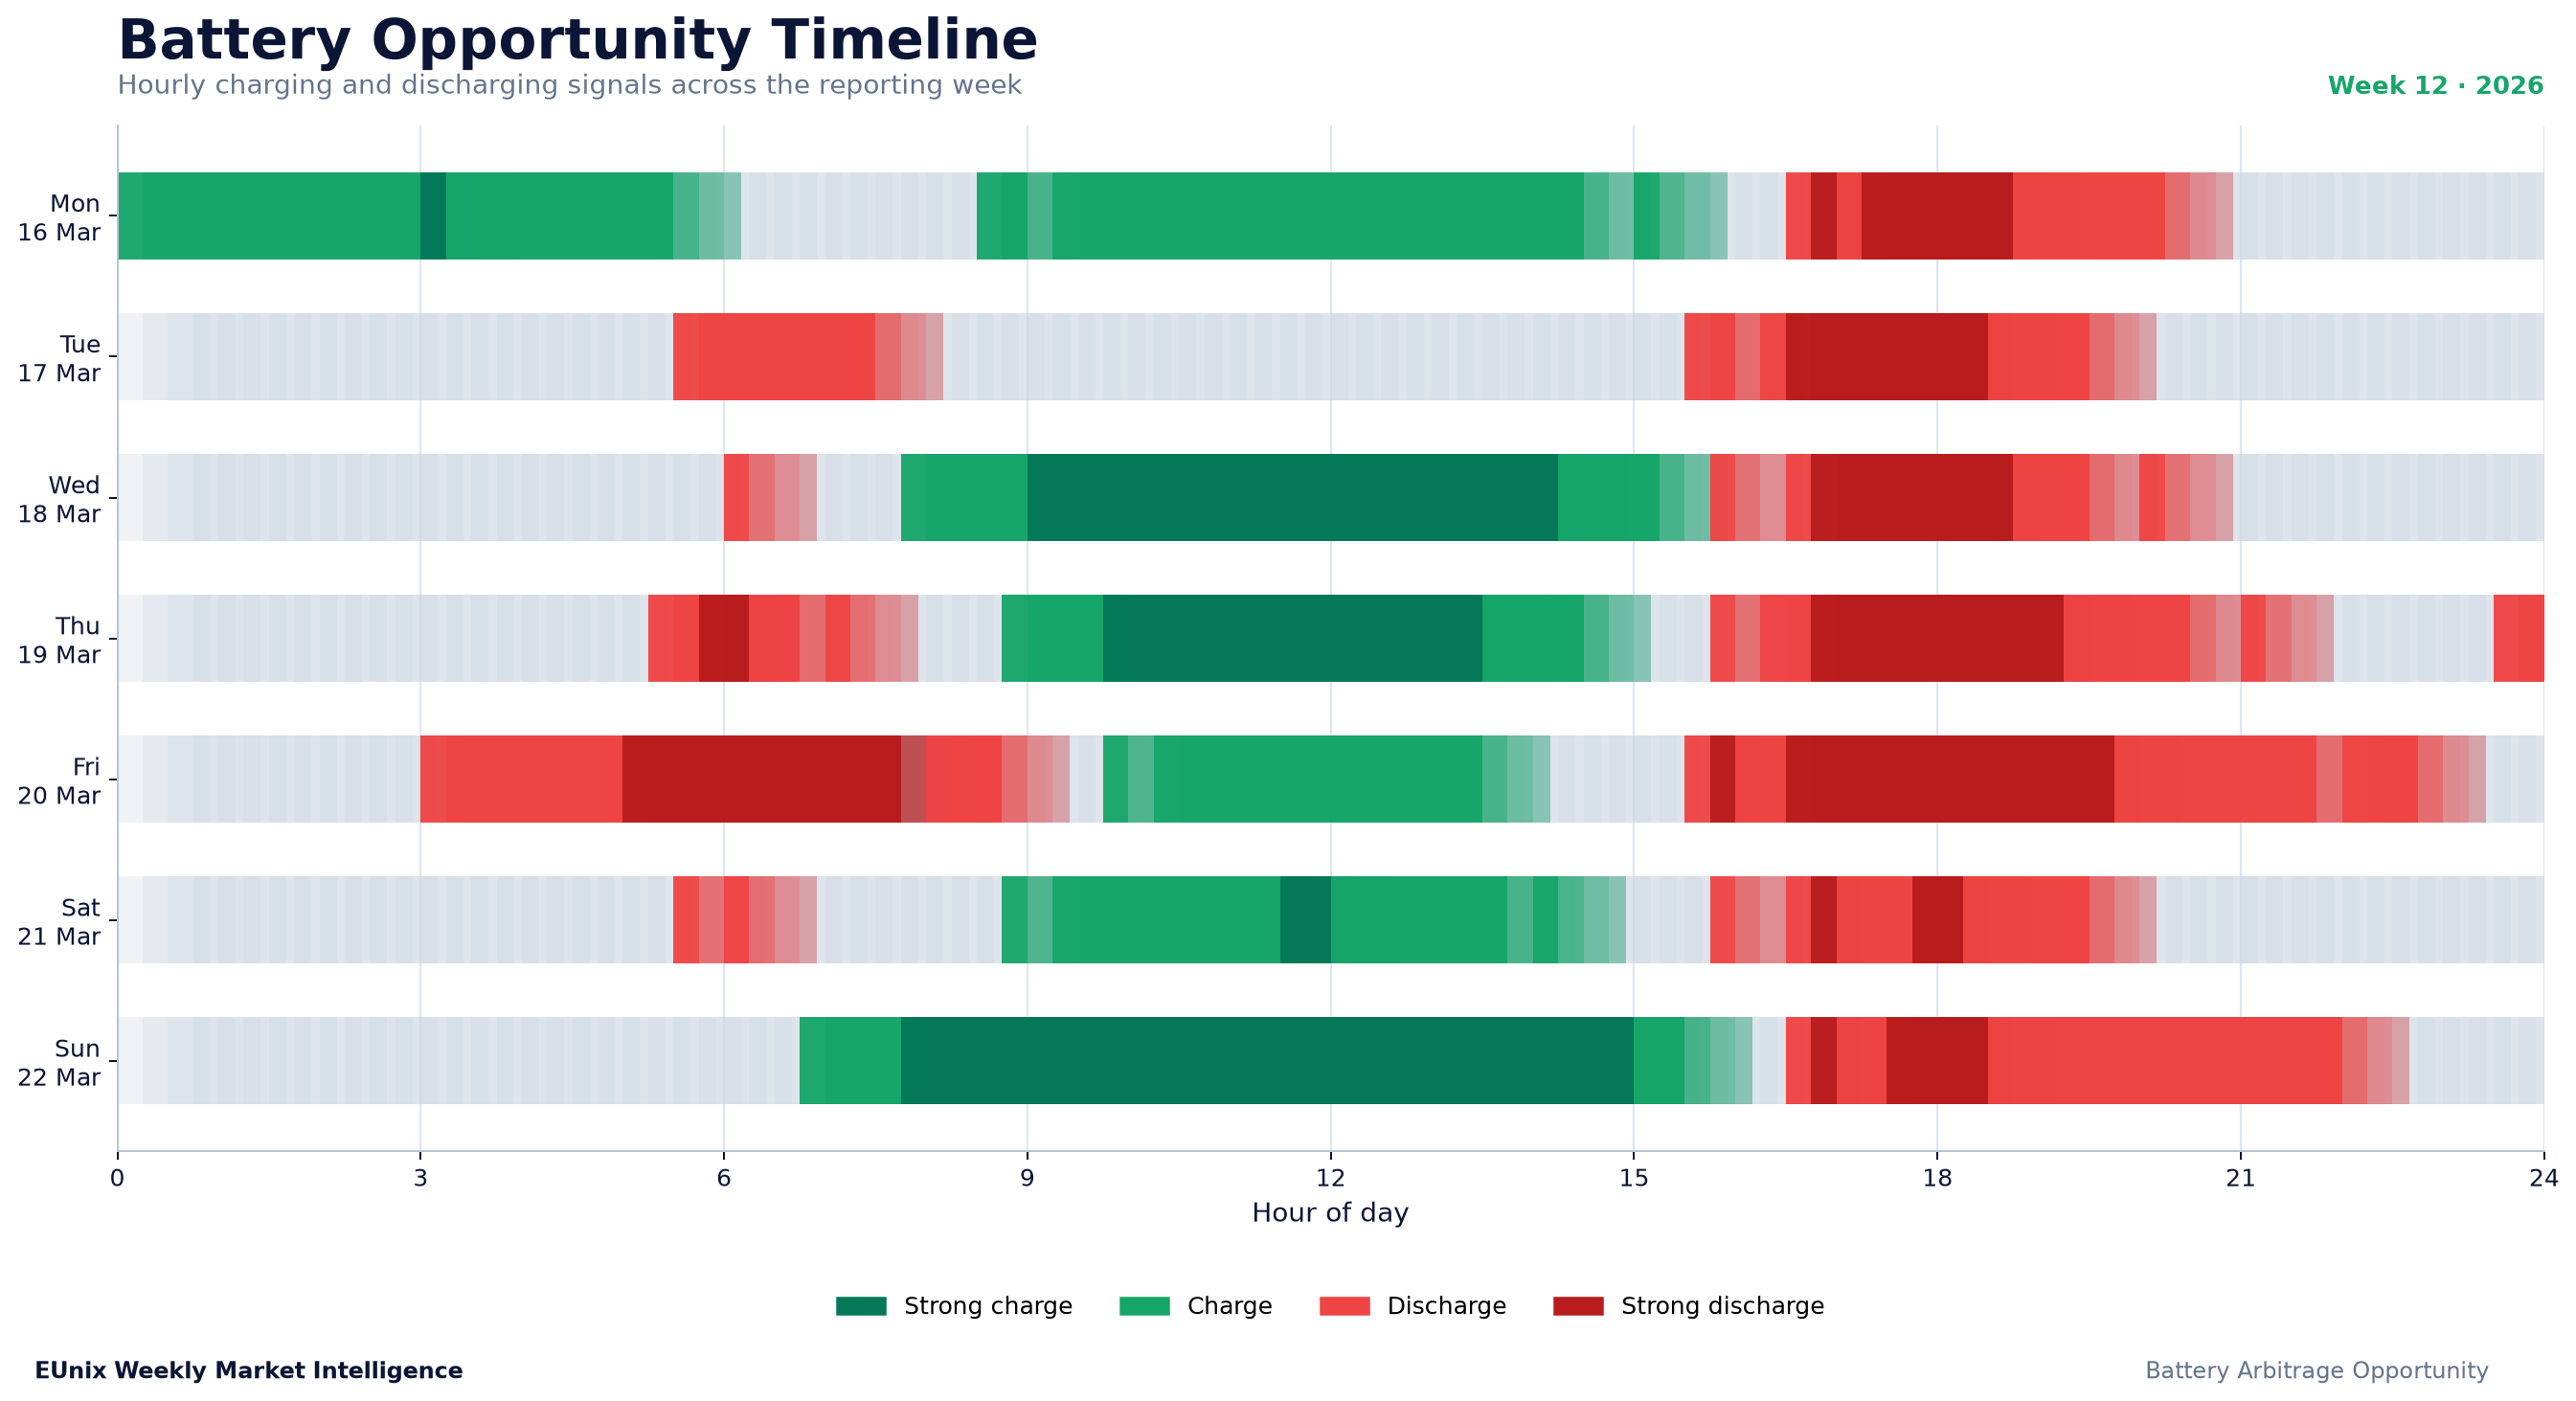
Germany experienced another strong battery-arbitrage week as wholesale prices moved across an exceptionally wide range. EUnix Market Intelligence identified a maximum daily arbitrage spread of €249.24/MWh, 34 strong opportunity hours, and several negative-price periods. An illustrative 1 MW / 1 MWh battery simulation produced €688 in gross weekly arbitrage revenue, showing how strongly timed charging and discharging could benefit from the Week 12 price structure.
Charts
Market Overview
The story received a priority score of 90.49, supported by a detection strength of 94.69% and confidence of 83.37%.
The strongest signal was a maximum daily arbitrage spread of €249.24/MWh, while approximately 34 hours were classified as strong charging or discharging opportunities.
The wholesale price environment was highly favourable for storage. Prices reached a weekly maximum of approximately €261.1/MWh and fell as low as −€54.6/MWh, while the weekly average was about €111.6/MWh.
The supporting analytics reinforced the storage story. Battery opportunity scored 94.26, followed by negative prices at 80.41 and price volatility at 64.54. The high negative-price score is particularly important because Week 12 combined substantial positive-price peaks with deep low-price charging windows.
Key Observations
Interpretation
The price curve shows repeated episodes in which wholesale prices fell toward zero or below zero before later recovering above €150/MWh and, in some periods, above €200/MWh.
This is precisely the kind of market structure that creates value for storage.
Negative prices improve the charging side of the arbitrage equation because batteries can acquire energy at extremely low cost. In Week 12, the weekly minimum fell to −€54.6/MWh, creating substantially stronger charging economics than would be available during an ordinary positive-price trough.
But the high daily arbitrage spread should not be interpreted as automatically captureable revenue.
A battery cannot necessarily charge at the absolute minimum price and discharge at the absolute maximum price every day. The realised outcome depends on state of charge, power and energy limits, efficiency losses, dispatch timing and the opportunity cost of using available capacity too early.
The difference between the €249.24/MWh maximum theoretical spread and the simulated €174.3/MWh realised spread illustrates this clearly.
Week 12 therefore reinforces an important principle of battery economics: price volatility creates the opportunity, but dispatch optimisation determines how much of that opportunity can actually be captured.
Revenue Insight
Market Outlook
The most important indicators to monitor in subsequent weeks are therefore negative-price duration, daily arbitrage spread, charging-window frequency, high-price discharge periods and the persistence of wholesale-price volatility.
If negative-price periods become more frequent while later-day price recovery remains strong, standalone energy arbitrage could continue to support battery revenue.
If energy spreads begin to compress, battery operators may need to rely more heavily on revenue stacking across wholesale arbitrage, FCR, aFRR and other flexibility products.
The broader Week 12 message is that storage economics are increasingly shaped by when electricity becomes abundant and when scarcity returns, rather than by average weekly prices alone.
Simulation Note
Written by
Dr. G. O. C. Okwuibe
Quantitative Energy Systems Expert | Electricity Market & BESS
Dr. Godwin Okwuibe is a quantitative energy system expert specializing in electricity markets, battery storage optimization, and flexibility market design. His work focusses on translating complex market dynamics into actionable insights for industry stakehold...