
 Dr. G. O. C. Okwuibe
Battery Arbitrage Opportunity — Week 13, 2026
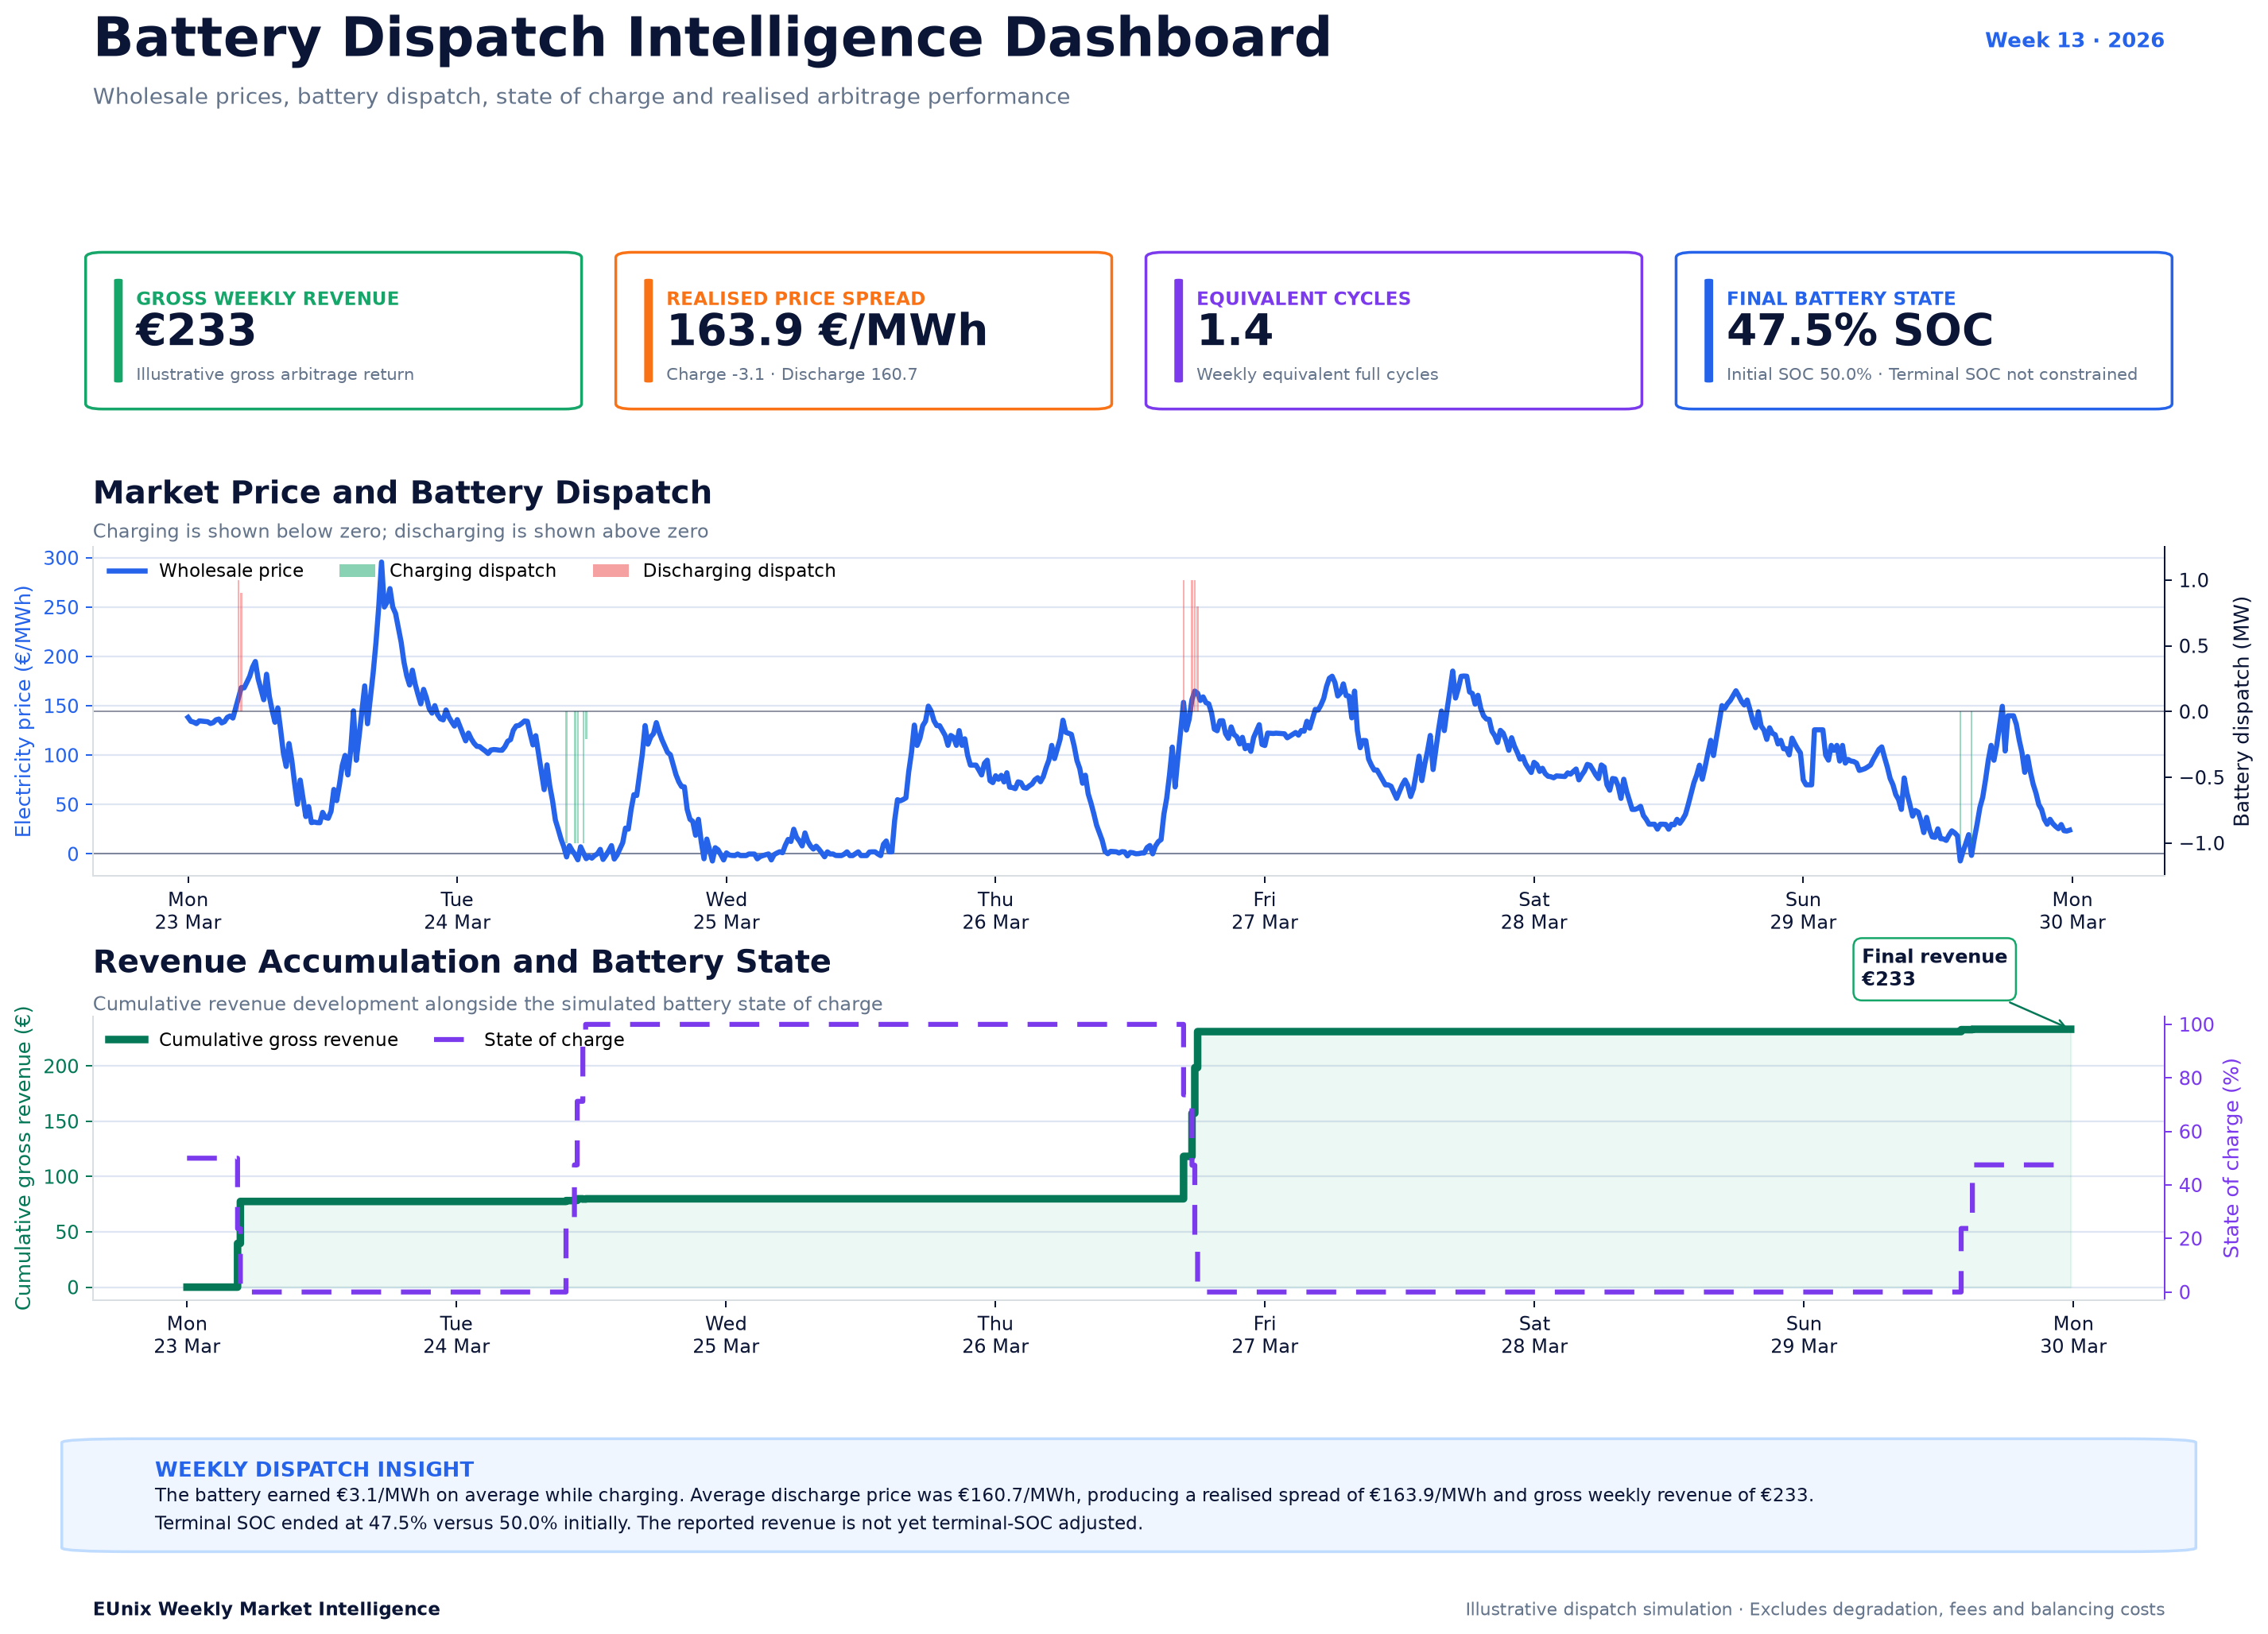
Germany experienced another high-value battery-arbitrage week as wholesale electricity prices moved from slightly negative levels to almost €300/MWh. EUnix Market Intelligence identified a maximum daily arbitrage spread of €264.03/MWh and 34 strong opportunity hours. An illustrative 1 MW / 1 MWh battery simulation produced €233 in gross weekly arbitrage revenue, showing that strong market spreads do not always translate into equally high realised returns.
Charts
Market Overview
The story received a priority score of 91.02, supported by a detection strength of 94.67% and confidence of 82.57%.
The dominant signal was a maximum daily arbitrage spread of €264.03/MWh, while approximately 34 hours were classified as strong charging or discharging opportunities.
Wholesale prices ranged from approximately −€7.2/MWh to €295.6/MWh, with a weekly average of around €85.2/MWh. The supporting analytics were also strong: battery opportunity scored 96.4, negative-price conditions scored 72.1, and price volatility scored 65.37.
The combination of occasional negative prices, very high positive price peaks, and recurring low-price charging windows created a technically attractive environment for battery storage.
Key Observations
Interpretation
At first glance, the market conditions were highly attractive. The maximum theoretical spread exceeded €260/MWh, wholesale prices briefly rose to almost €300/MWh, and the market also produced negative-price charging opportunities.
However, the simulated battery completed only 1.4 equivalent cycles, considerably fewer than in some previous high-volatility weeks.
This suggests that the most valuable opportunities were concentrated in a smaller number of periods rather than evenly distributed throughout the week.
The battery-opportunity timeline reinforces this pattern. Strong charging conditions appeared around selected low-price periods, particularly midweek, while strong discharge windows were clustered around specific high-price intervals rather than continuously available.
The negative average charging price is particularly noteworthy. At −€3.1/MWh, the simulated battery was effectively compensated for some of the electricity it absorbed. This significantly improves the economics of later discharge, even if the number of profitable cycles remains limited.
The result demonstrates that a very large theoretical spread does not necessarily imply frequent cycling or high total weekly revenue. What matters is how often attractive price pairs occur, whether they align with the battery’s state of charge, and whether preserving capacity for a later opportunity creates more value than immediate dispatch.
Revenue Insight
Market Outlook
The most important indicators to monitor in subsequent weeks are therefore not just the maximum daily spread, but also the number of strong opportunity hours, frequency of negative prices, duration of low-price windows, expected cycle count and persistence of high-price recovery periods.
If negative-price episodes become more frequent while strong evening or scarcity-driven peaks continue, battery arbitrage value could increase significantly.
If large price spreads remain isolated to only a few events, however, batteries may experience high per-cycle value but lower overall weekly utilisation.
This increases the importance of revenue stacking, particularly where batteries can combine wholesale arbitrage with FCR, aFRR or other flexibility services during periods when energy-arbitrage activity is limited.
The broader Week 13 message is therefore clear: the size of the spread determines the value of an individual opportunity, but the frequency and timing of those opportunities determine weekly battery economics.
Simulation Note
Written by
Dr. G. O. C. Okwuibe
Quantitative Energy Systems Expert | Electricity Market & BESS
Dr. Godwin Okwuibe is a quantitative energy system expert specializing in electricity markets, battery storage optimization, and flexibility market design. His work focusses on translating complex market dynamics into actionable insights for industry stakehold...