
 Dr. G. O. C. Okwuibe
Battery Arbitrage Opportunity — Week 16, 2026
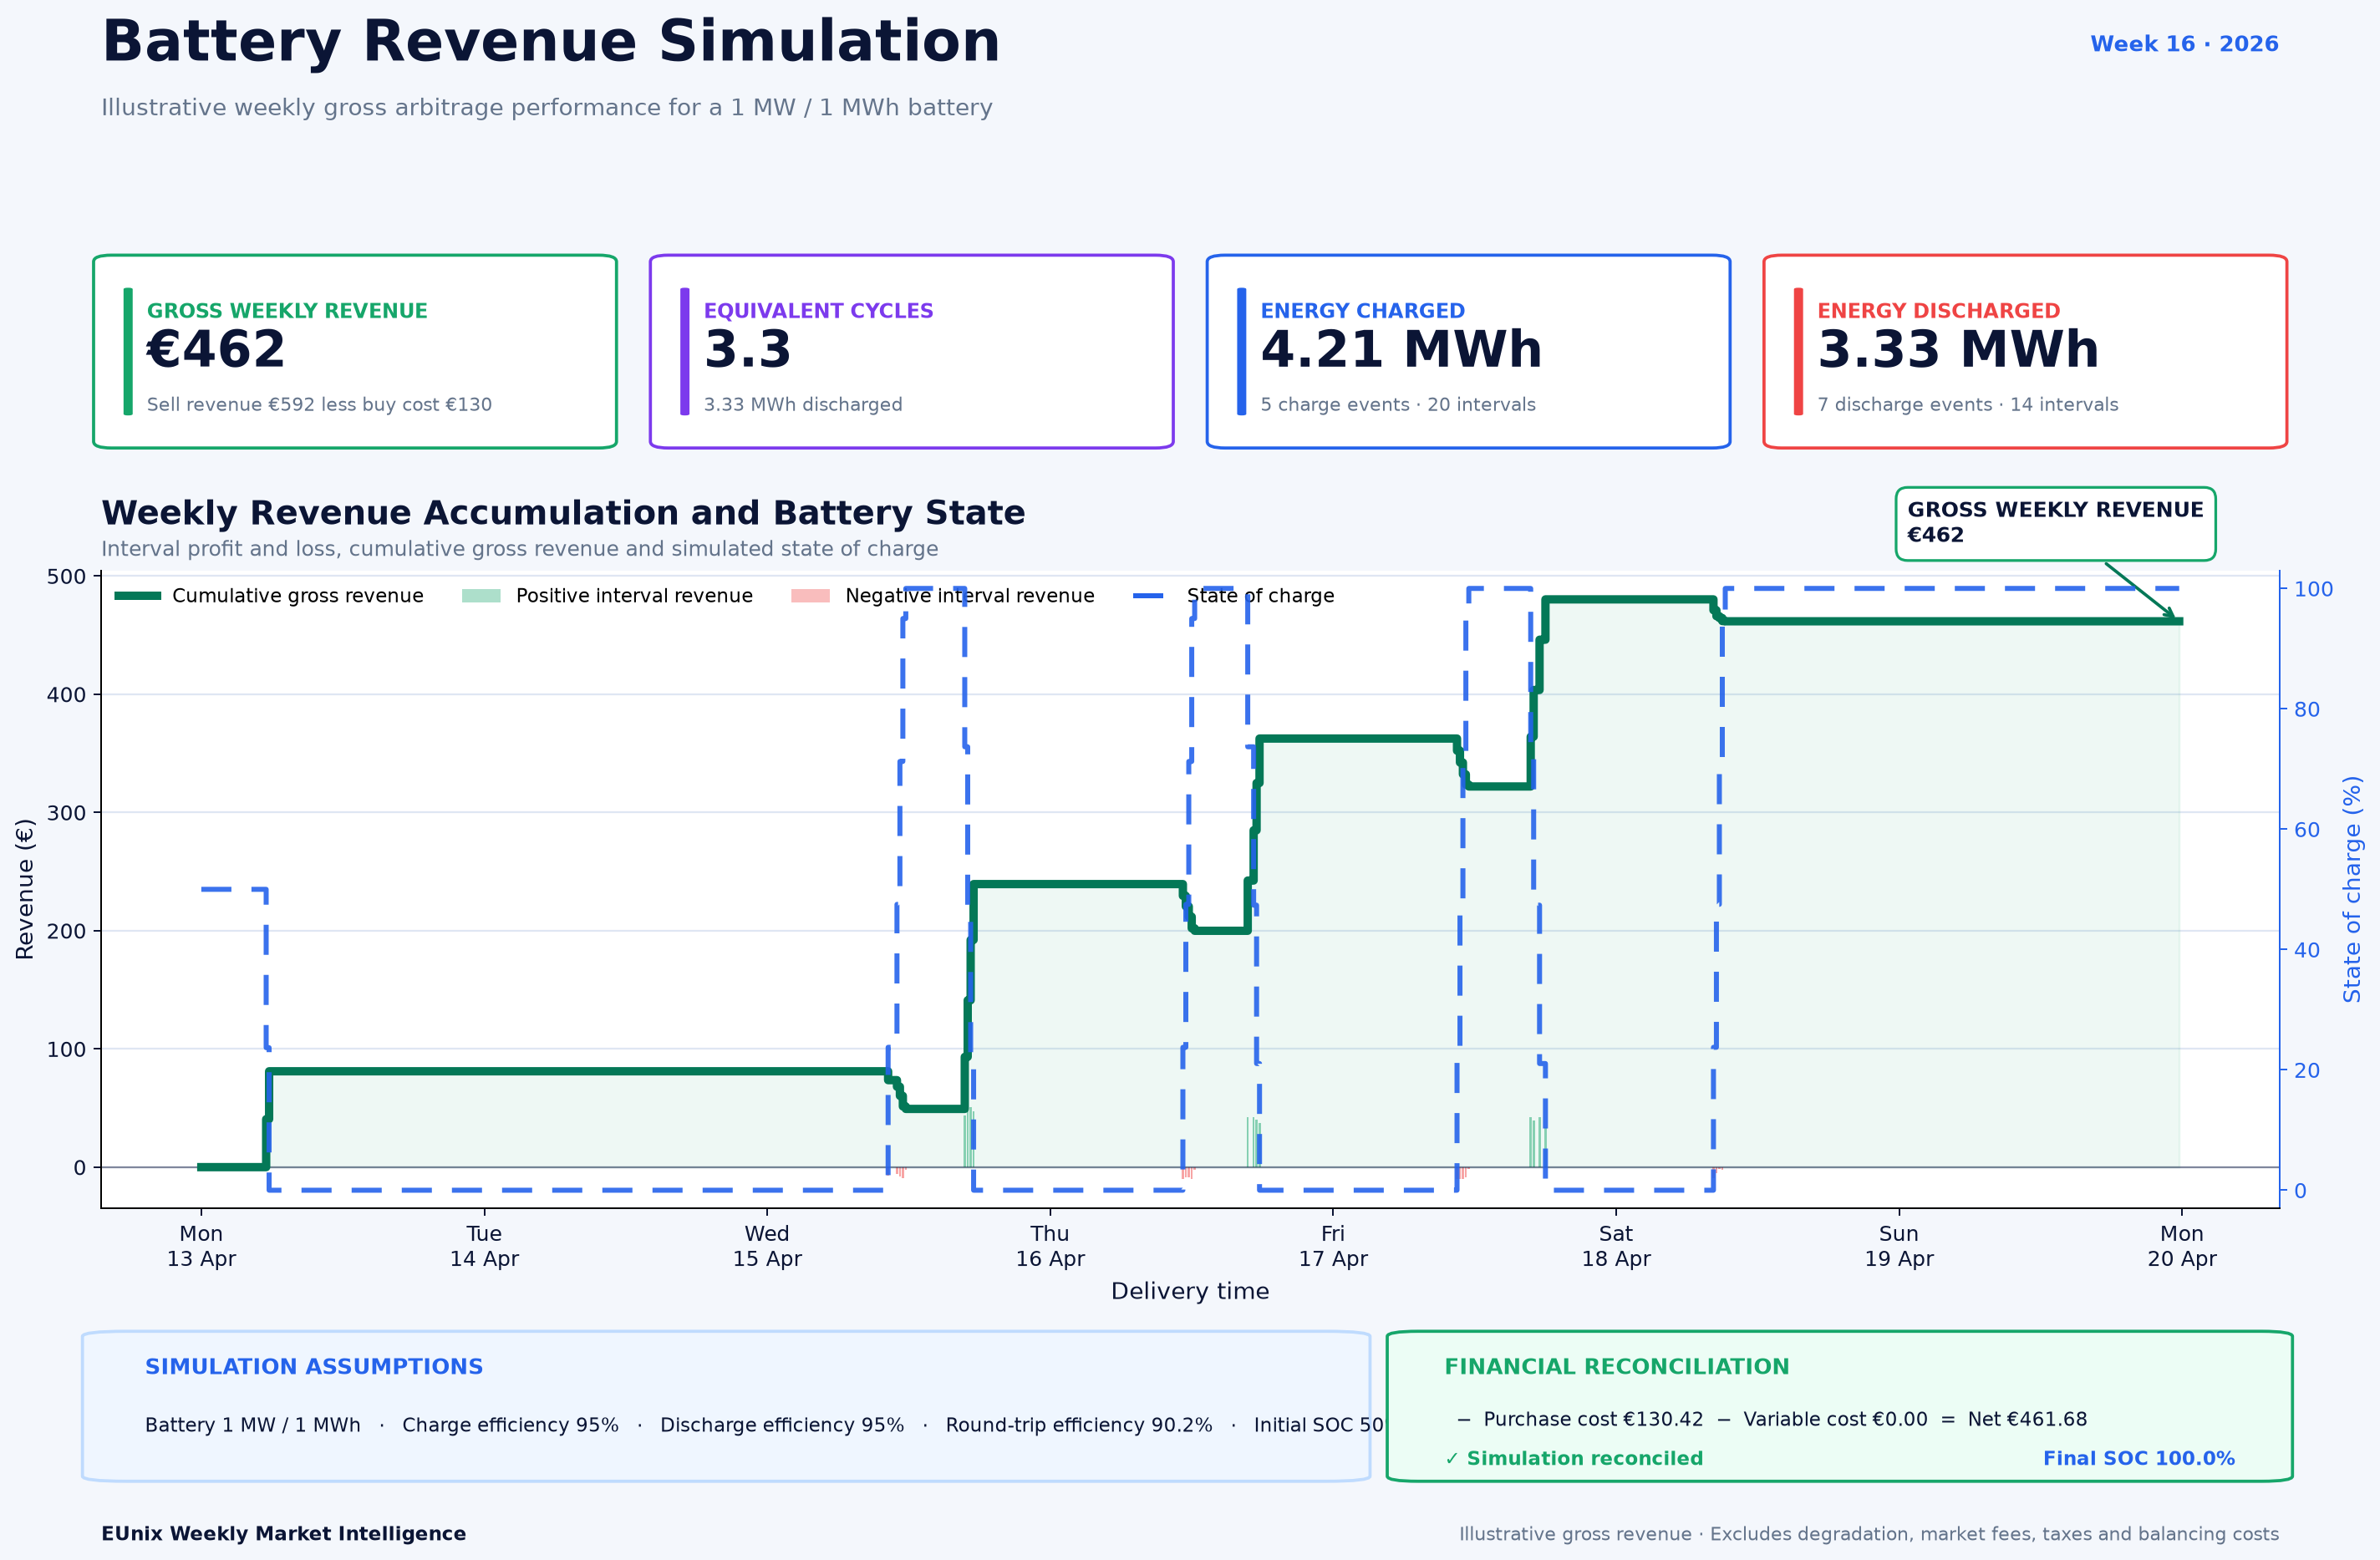
Wholesale electricity prices created attractive battery-trading conditions during Week 16. EUnix Market Intelligence identified a maximum daily arbitrage spread of €229.66/MWh and 34 strong opportunity hours. An illustrative 1 MW / 1 MWh battery simulation generated €462 gross weekly revenue, demonstrating how recurring low-price charging windows and higher-price discharge periods could be monetised.
Charts
Market Overview
The story received a priority score of 87.59, supported by detection strength of 90.65% and confidence of 76.10%.
The primary signal was a maximum daily charging-to-discharging spread of €229.66/MWh, while 34 hours were classified as strong battery-opportunity periods.
Battery opportunity was by far the strongest supporting analytical signal, scoring 94.04. Negative-price conditions scored 58.56, while price volatility scored 57.76.
The weekly electricity-price curve shows prices ranging from approximately −€7.9/MWh to €251.9/MWh, against a weekly average of around €107.5/MWh. This created repeated periods in which batteries could potentially charge at relatively low prices and discharge after subsequent market-price recovery.
Key Observations
Interpretation
The market clearly contained substantial price movement. Electricity reached almost €252/MWh at its weekly maximum while also falling slightly below zero. However, what matters operationally for storage is whether these movements occur in a sequence that a battery can exploit.
The opportunity timeline shows exactly that structure.
Several days contained lower-price daytime windows followed by substantially higher afternoon or evening prices. This allowed energy to be shifted temporally rather than merely exposing the battery to isolated price spikes.
Wednesday provides the strongest example. The daily arbitrage spread reached almost €230/MWh, creating a particularly attractive charging-to-discharging differential.
The important distinction is between the maximum theoretical daily spread of €229.66/MWh and the realised simulated spread of €148.4/MWh.
A battery cannot necessarily buy exactly at the weekly minimum and sell exactly at the weekly maximum. State-of-charge constraints, efficiency losses, timing, available capacity and previous dispatch decisions all affect the spread that can actually be captured.
This is why the simulated result provides an important second layer of intelligence beyond simply measuring market volatility.
Revenue Insight
Market Outlook
For battery operators, particularly attractive conditions would include recurring midday price depressions, negative-price events, strong evening price recovery and sufficiently wide spreads after accounting for efficiency losses and cycling costs.
Week 16 already displayed several of these characteristics.
At the same time, the relatively moderate scores for price volatility at 57.76 and negative prices at 58.56, compared with the battery-opportunity score of 94.04, provide an important insight: storage value can remain attractive even when neither general volatility nor negative prices independently appear extreme.
What matters is the structure of the price curve and whether charge and discharge opportunities occur in usable sequence.
For investors and operators, this reinforces a broader principle: battery economics depend less on isolated extreme prices than on consistently captureable spreads across the operating cycle.
Simulation Note
Written by
Dr. G. O. C. Okwuibe
Quantitative Energy Systems Expert | Electricity Market & BESS
Dr. Godwin Okwuibe is a quantitative energy system expert specializing in electricity markets, battery storage optimization, and flexibility market design. His work focusses on translating complex market dynamics into actionable insights for industry stakehold...