
 Dr. G. O. C. Okwuibe
Battery Arbitrage Opportunity — Week 19, 2026
Battery arbitrage conditions remained exceptionally strong in Week 19, supported by wide intraday price separation, recurring charging and discharging windows, and another episode of negative electricity prices. EUnix Market Intelligence detected a maximum daily arbitrage spread of €374.69/MWh, 34 strong opportunity hours, and wholesale prices ranging from approximately €250.1/MWh to -€124.6/MWh. An illustrative 1 MW / 1 MWh battery simulation produced €477 gross weekly revenue, confirming that the week offered significant—but unevenly distributed—storage value.
Charts
Market Overview
The story received a priority score of 95.82, supported by an exceptionally strong detection strength of 98.96% and confidence of 96.26%.
The dominant signal was a maximum daily battery arbitrage spread of €374.69/MWh, while 34 hours were classified as strong battery-opportunity periods.
Supporting analytics were also very strong. Battery opportunity scored 98.33, followed by price volatility at 96.95 and negative prices at 91.45.
The story-intelligence components further reinforced the significance of the event, with severity at 99.6, impact at 95.5, opportunity/risk at 88.9, novelty at 98.0, and confidence at 96.3.
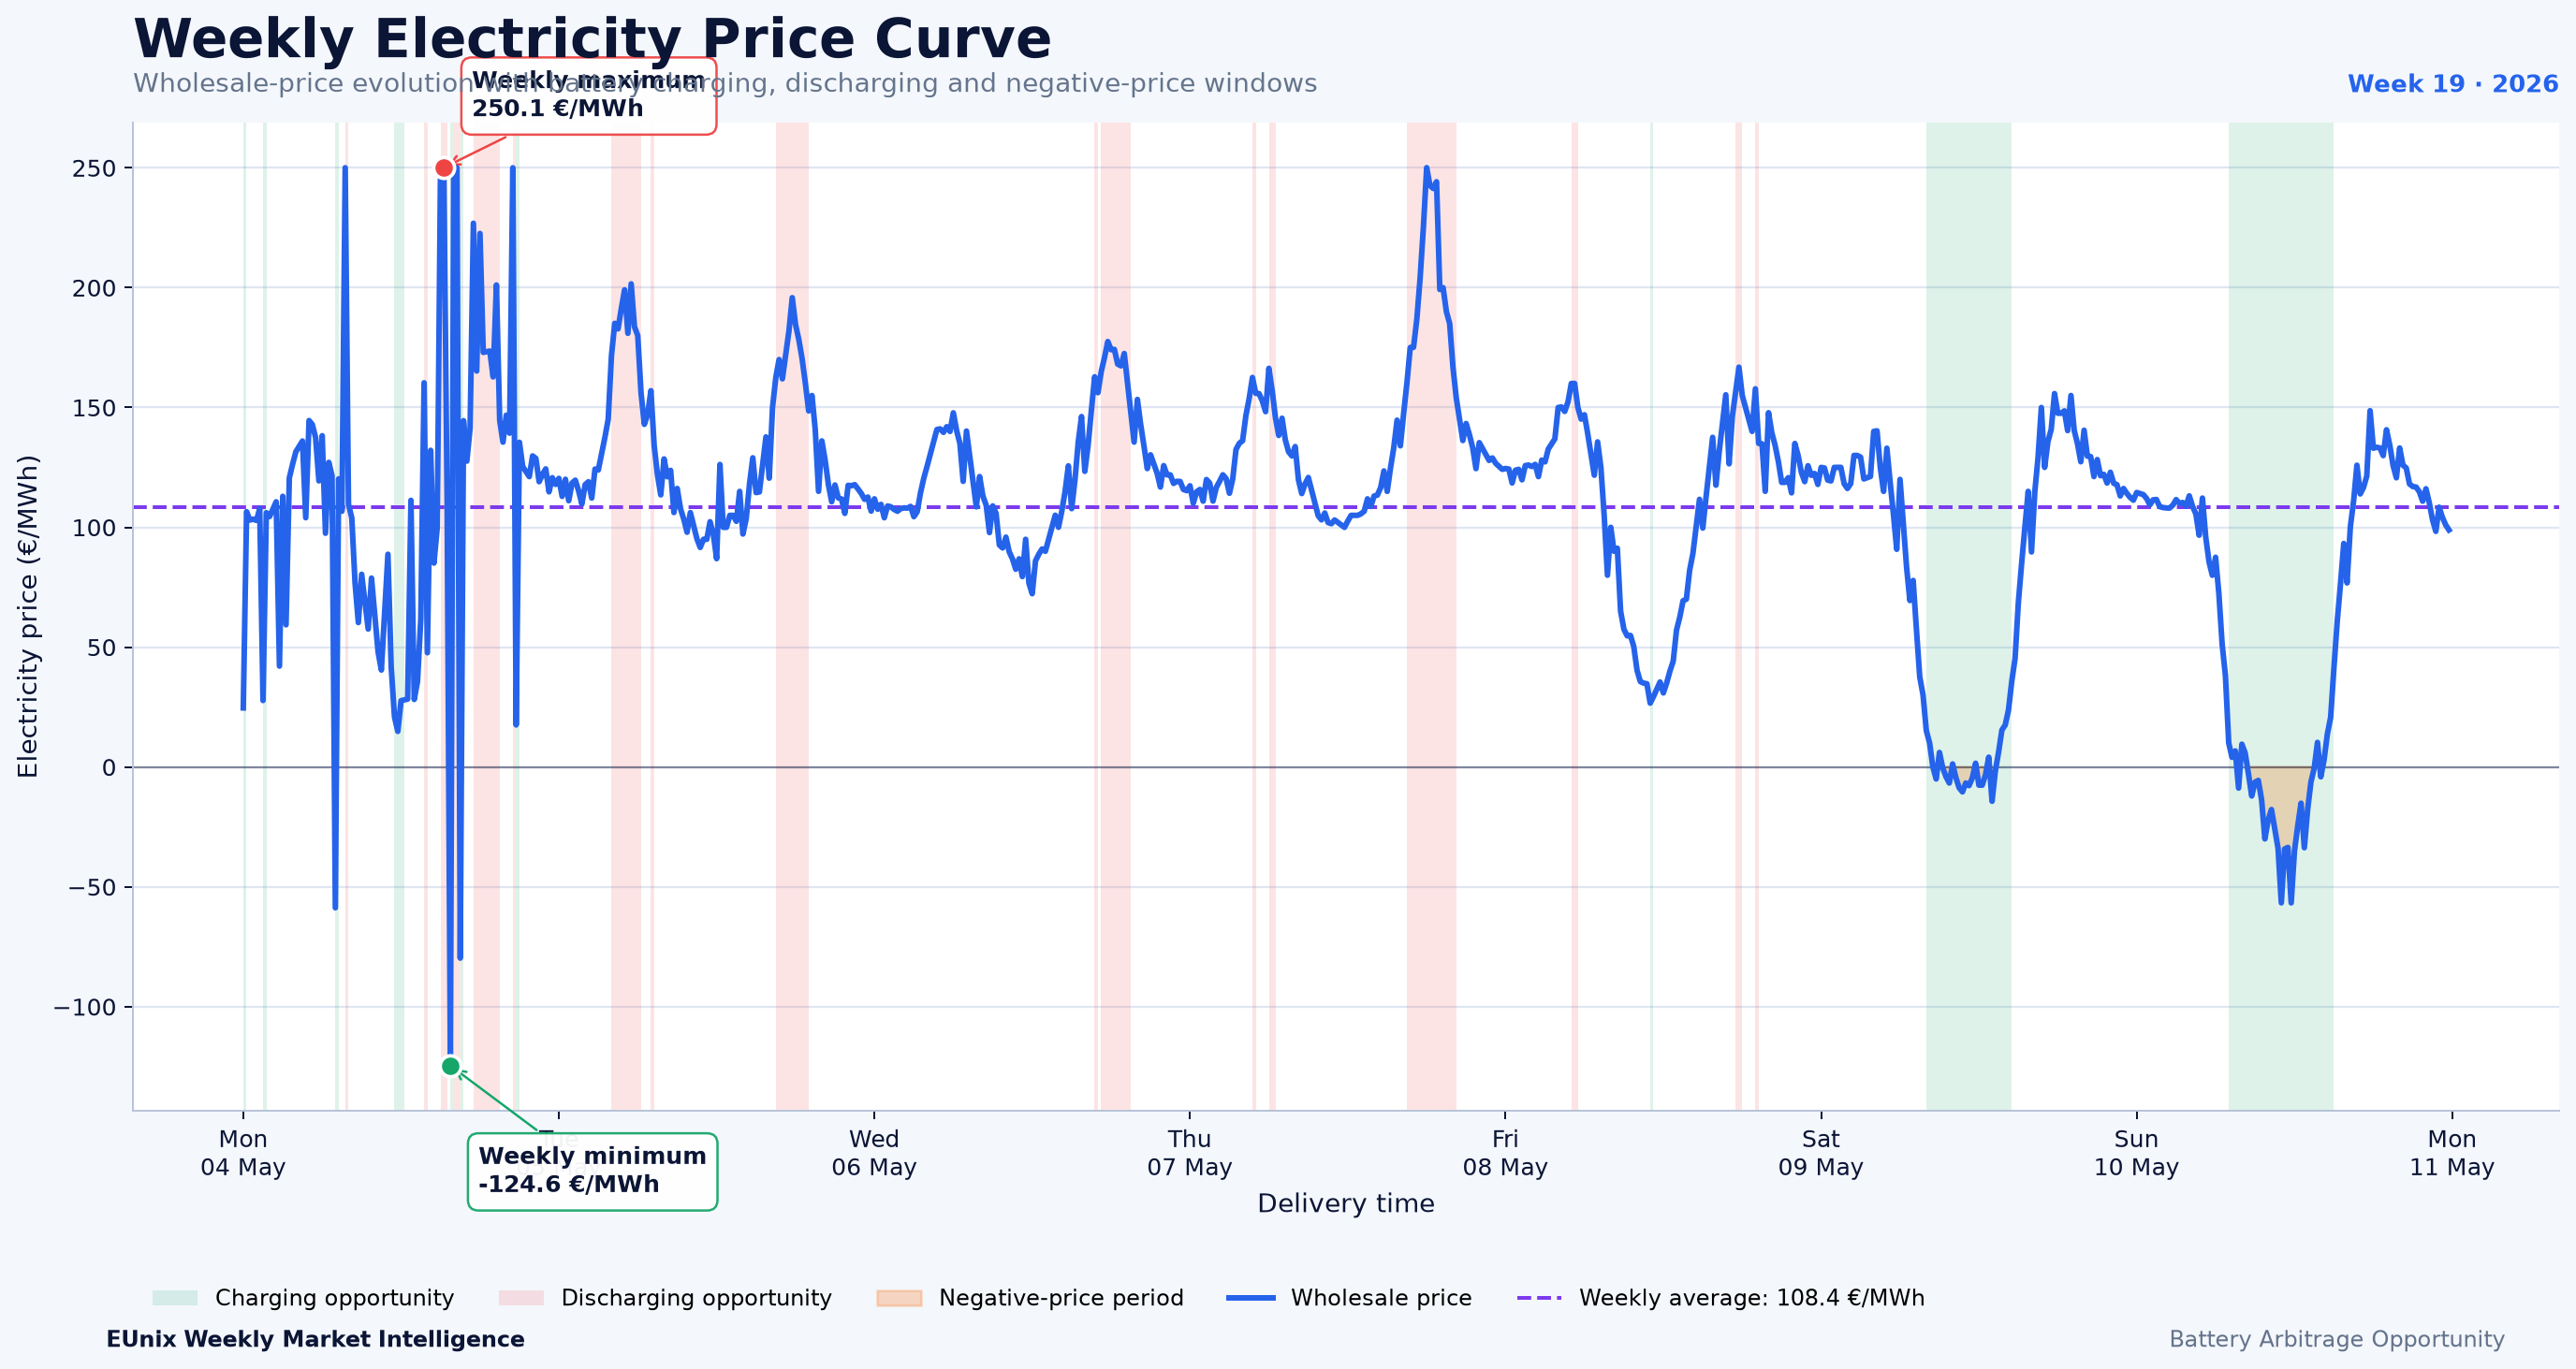
The wholesale-price curve shows why the opportunity was so pronounced. Prices reached a weekly maximum of approximately €250.1/MWh and a minimum of -€124.6/MWh, while the weekly average stood near €108.4/MWh.
The combination of negative-price periods, sharp positive-price spikes and recurring daily price cycles created clear conditions for battery charging and discharge optimisation.
Key Observations
Interpretation
The market signal itself was extremely strong. A maximum daily spread of almost €375/MWh, negative prices below -€120/MWh, and a battery-opportunity score above 98 all indicate a highly volatile and storage-friendly market environment.
However, the simulated battery produced only 2.1 equivalent cycles and €477 of gross weekly revenue.
That contrasts with the strength of the headline market signal.
The reason is visible in the dispatch and daily-performance charts: much of the realised value was concentrated in a limited number of actual dispatch events, particularly on Monday. The market contained many theoretical charging and discharging windows, but the simulated battery did not monetise all of them.
This is commercially important.
A large headline arbitrage spread does not automatically translate into proportionally large weekly battery revenue. Revenue depends on the sequence of opportunities, state of charge, battery power and energy limits, efficiency, dispatch logic and whether the battery has already reached a physical operating constraint.
Week 19 therefore shows why asset-level simulation is essential alongside market-level opportunity detection.
Revenue Insight
Market Outlook
The weekly average price was approximately €108.4/MWh, but this single value hides substantial volatility ranging from -€124.6/MWh to €250.1/MWh.
For storage operators, the key indicators remain negative-price duration, intraday spread magnitude, timing of high-price recovery, opportunity-window recurrence and the ability of the battery to enter those windows with sufficient available energy capacity.
The later part of Week 19 is particularly notable because charging opportunities became longer and more regular during daytime hours. If such patterns continue while evening prices remain elevated, they would support more systematic storage cycling.
The key analytical question in future weeks is therefore not simply whether large spreads exist, but how consistently those spreads can be captured by a real battery under power, energy, SOC and cycling constraints.
Simulation Note
Written by
Dr. G. O. C. Okwuibe
Quantitative Energy Systems Expert | Electricity Market & BESS
Dr. Godwin Okwuibe is a quantitative energy system expert specializing in electricity markets, battery storage optimization, and flexibility market design. His work focusses on translating complex market dynamics into actionable insights for industry stakehold...