
 Dr. G. O. C. Okwuibe
Duck Curve and Flexibility Stress — Week 07, 2026
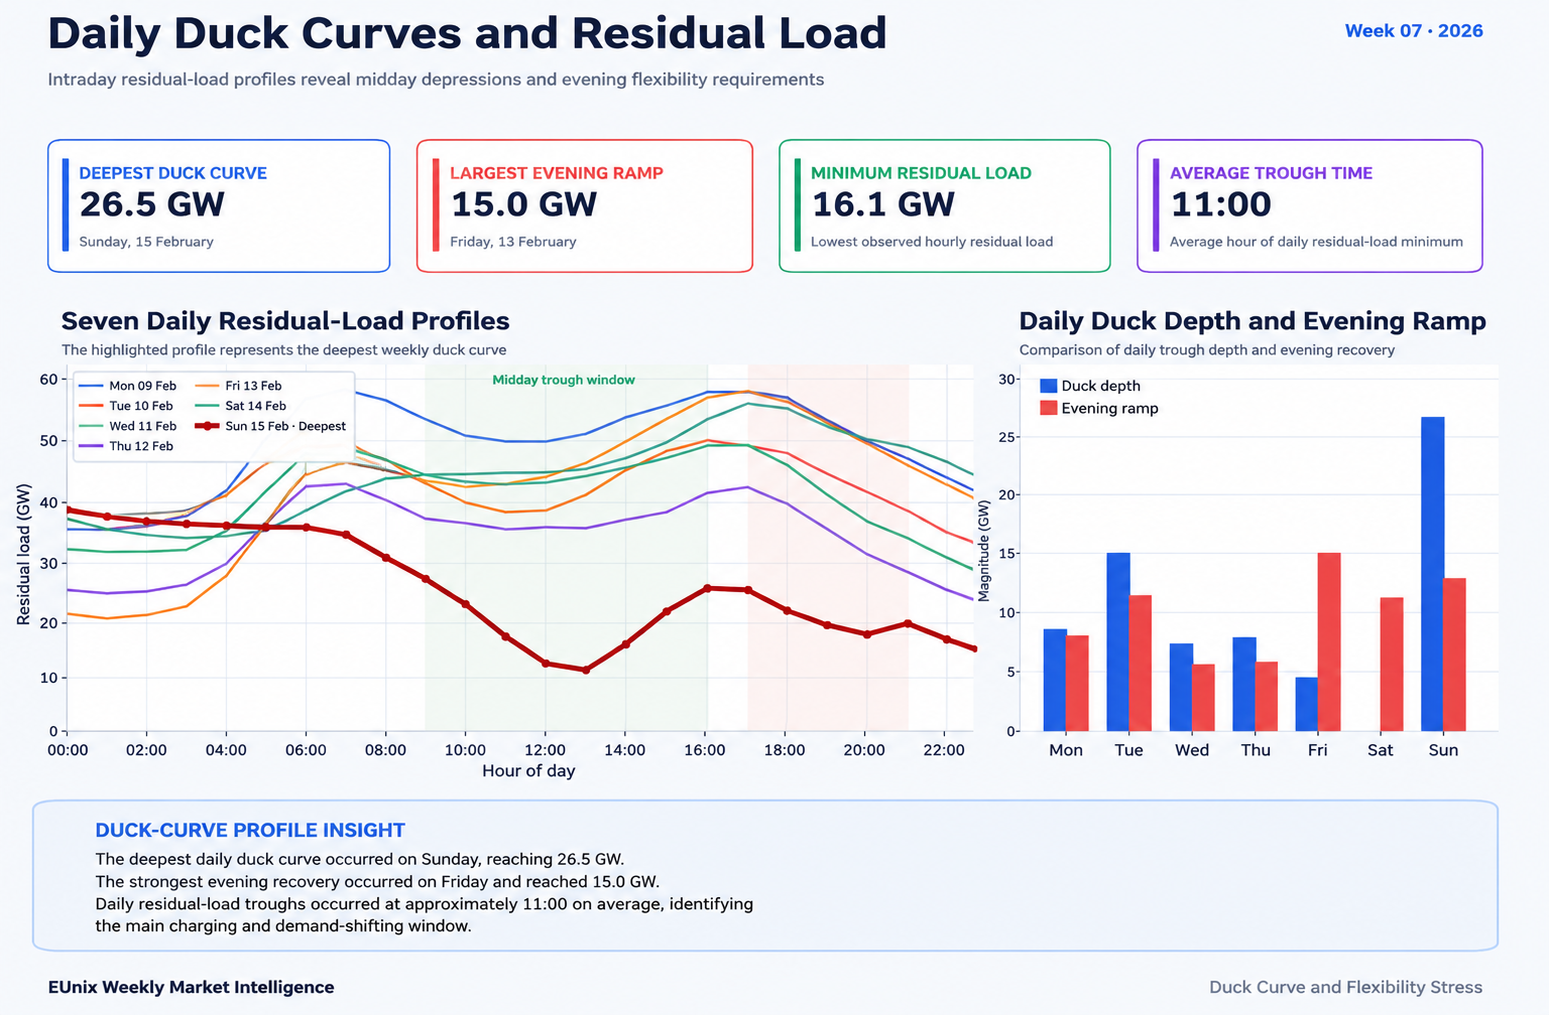
Large swings in Germany’s residual electricity demand created significant flexibility requirements during Week 07. EUnix Market Intelligence detected a duck-curve depth of almost 38 GW, evening ramps exceeding 20 GW, and 68 critical residual-load ramp intervals — highlighting the growing value of fast, flexible resources in balancing renewable-rich power systems.
Charts
Market Overview
The story received a priority score of 86.35, supported by a very strong detection strength of 93.17% and confidence of 75.68%.
The dominant signal was a maximum duck-curve depth of 37,956.8 MW. More importantly for system operation, the maximum evening ramp reached 20,872.3 MW, while 68 intervals were classified as critical residual-load ramps.
These conditions created substantial requirements for resources capable of shifting consumption, storing surplus electricity, or rapidly adjusting generation.
The supporting analytics reinforce this interpretation. Demand-response opportunity scored 93.29, followed by duck-curve intensity at 81.78, storage utilisation at 67.88, and ramping stress at 64.97.
Key Observations
Interpretation
During periods of strong renewable production, residual load — the electricity demand remaining after renewable generation is accounted for — can fall substantially. As renewable output declines later in the day while electricity demand remains elevated, the system must rapidly replace that lost generation.
This creates the characteristic duck-curve shape.
The challenge is therefore not simply whether the power system has sufficient generation capacity. Increasingly, the question becomes how quickly the system can move from one operating condition to another.
A maximum evening ramp exceeding 20 GW is particularly important in this context. Large ramps increase the value of technologies capable of responding quickly, including battery storage, demand response, flexible generation, interconnection and smart EV charging.
The 68 critical ramp intervals detected during Week 07 suggest that this was not merely an interesting residual-load pattern. It represented a meaningful system flexibility event.
Revenue Insight
Market Outlook
Future weeks with deeper midday residual-load reductions combined with steeper evening recovery ramps would strengthen the case for storage and demand-side flexibility. Conversely, effective demand shifting, cross-border trading and storage deployment can flatten these ramps and reduce system stress.
The indicators to watch are therefore residual-load depth, evening ramp magnitude, critical ramp frequency, renewable generation profiles, electricity-price spreads and balancing-market conditions.
For investors and operators, the broader message is significant: as renewable penetration increases, flexibility itself becomes an increasingly valuable power-system resource.
Simulation Note
Written by
Dr. G. O. C. Okwuibe
Quantitative Energy Systems Expert | Electricity Market & BESS
Dr. Godwin Okwuibe is a quantitative energy system expert specializing in electricity markets, battery storage optimization, and flexibility market design. His work focusses on translating complex market dynamics into actionable insights for industry stakehold...