
 Dr. G. O. C. Okwuibe
Duck Curve and Flexibility Stress — Week 10, 2026
Germany experienced pronounced residual-load swings during Week 10 as renewable generation pushed midday system demand sharply lower before steep recovery later in the day. EUnix Market Intelligence detected a maximum duck-curve signal of 48.3 GW, 68 critical ramp intervals, and strong storage and demand-response conditions — highlighting a week in which flexibility became a central system requirement.
Charts
Market Overview
The story received a priority score of 87.33, supported by a very strong detection strength of 95.06% and confidence of 78.36%.
The dominant story-level signal was a maximum duck-curve depth of 48,307.8 MW, while the maximum evening-ramp indicator reached 25,467.7 MW. EUnix also identified 68 critical residual-ramp intervals and 84 storage-relevant hours during the reporting week.
The detailed residual-load profiles reinforce the broader signal. Average electricity demand reached 54.1 GW, renewable generation averaged 19.7 GW, and average residual load stood at 34.4 GW. Renewable penetration reached its highest daily share of 47.3% on Monday.
The supporting analytics were also strong. Demand-response opportunity scored 90.83, followed closely by duck-curve intensity at 89.87. Ramping scored 69.34, while storage utilisation reached 62.41.
Key Observations
Interpretation
During the late morning, increasing renewable output substantially reduced residual load. The average intraday system profile shows renewable generation rising from roughly 10 GW during the early morning to more than 40 GW around midday, while residual load simultaneously fell toward its daily minimum.
The challenge then reversed later in the day.
As renewable output declined, residual load recovered quickly. This transition required the system to move from relatively low conventional-generation requirements around midday to substantially higher requirements during the late afternoon and evening.
The scale of this movement is important. The issue is not simply whether sufficient generation capacity exists. The system must also possess enough ramping capability, storage, demand flexibility and cross-border support to transition between operating states quickly and repeatedly.
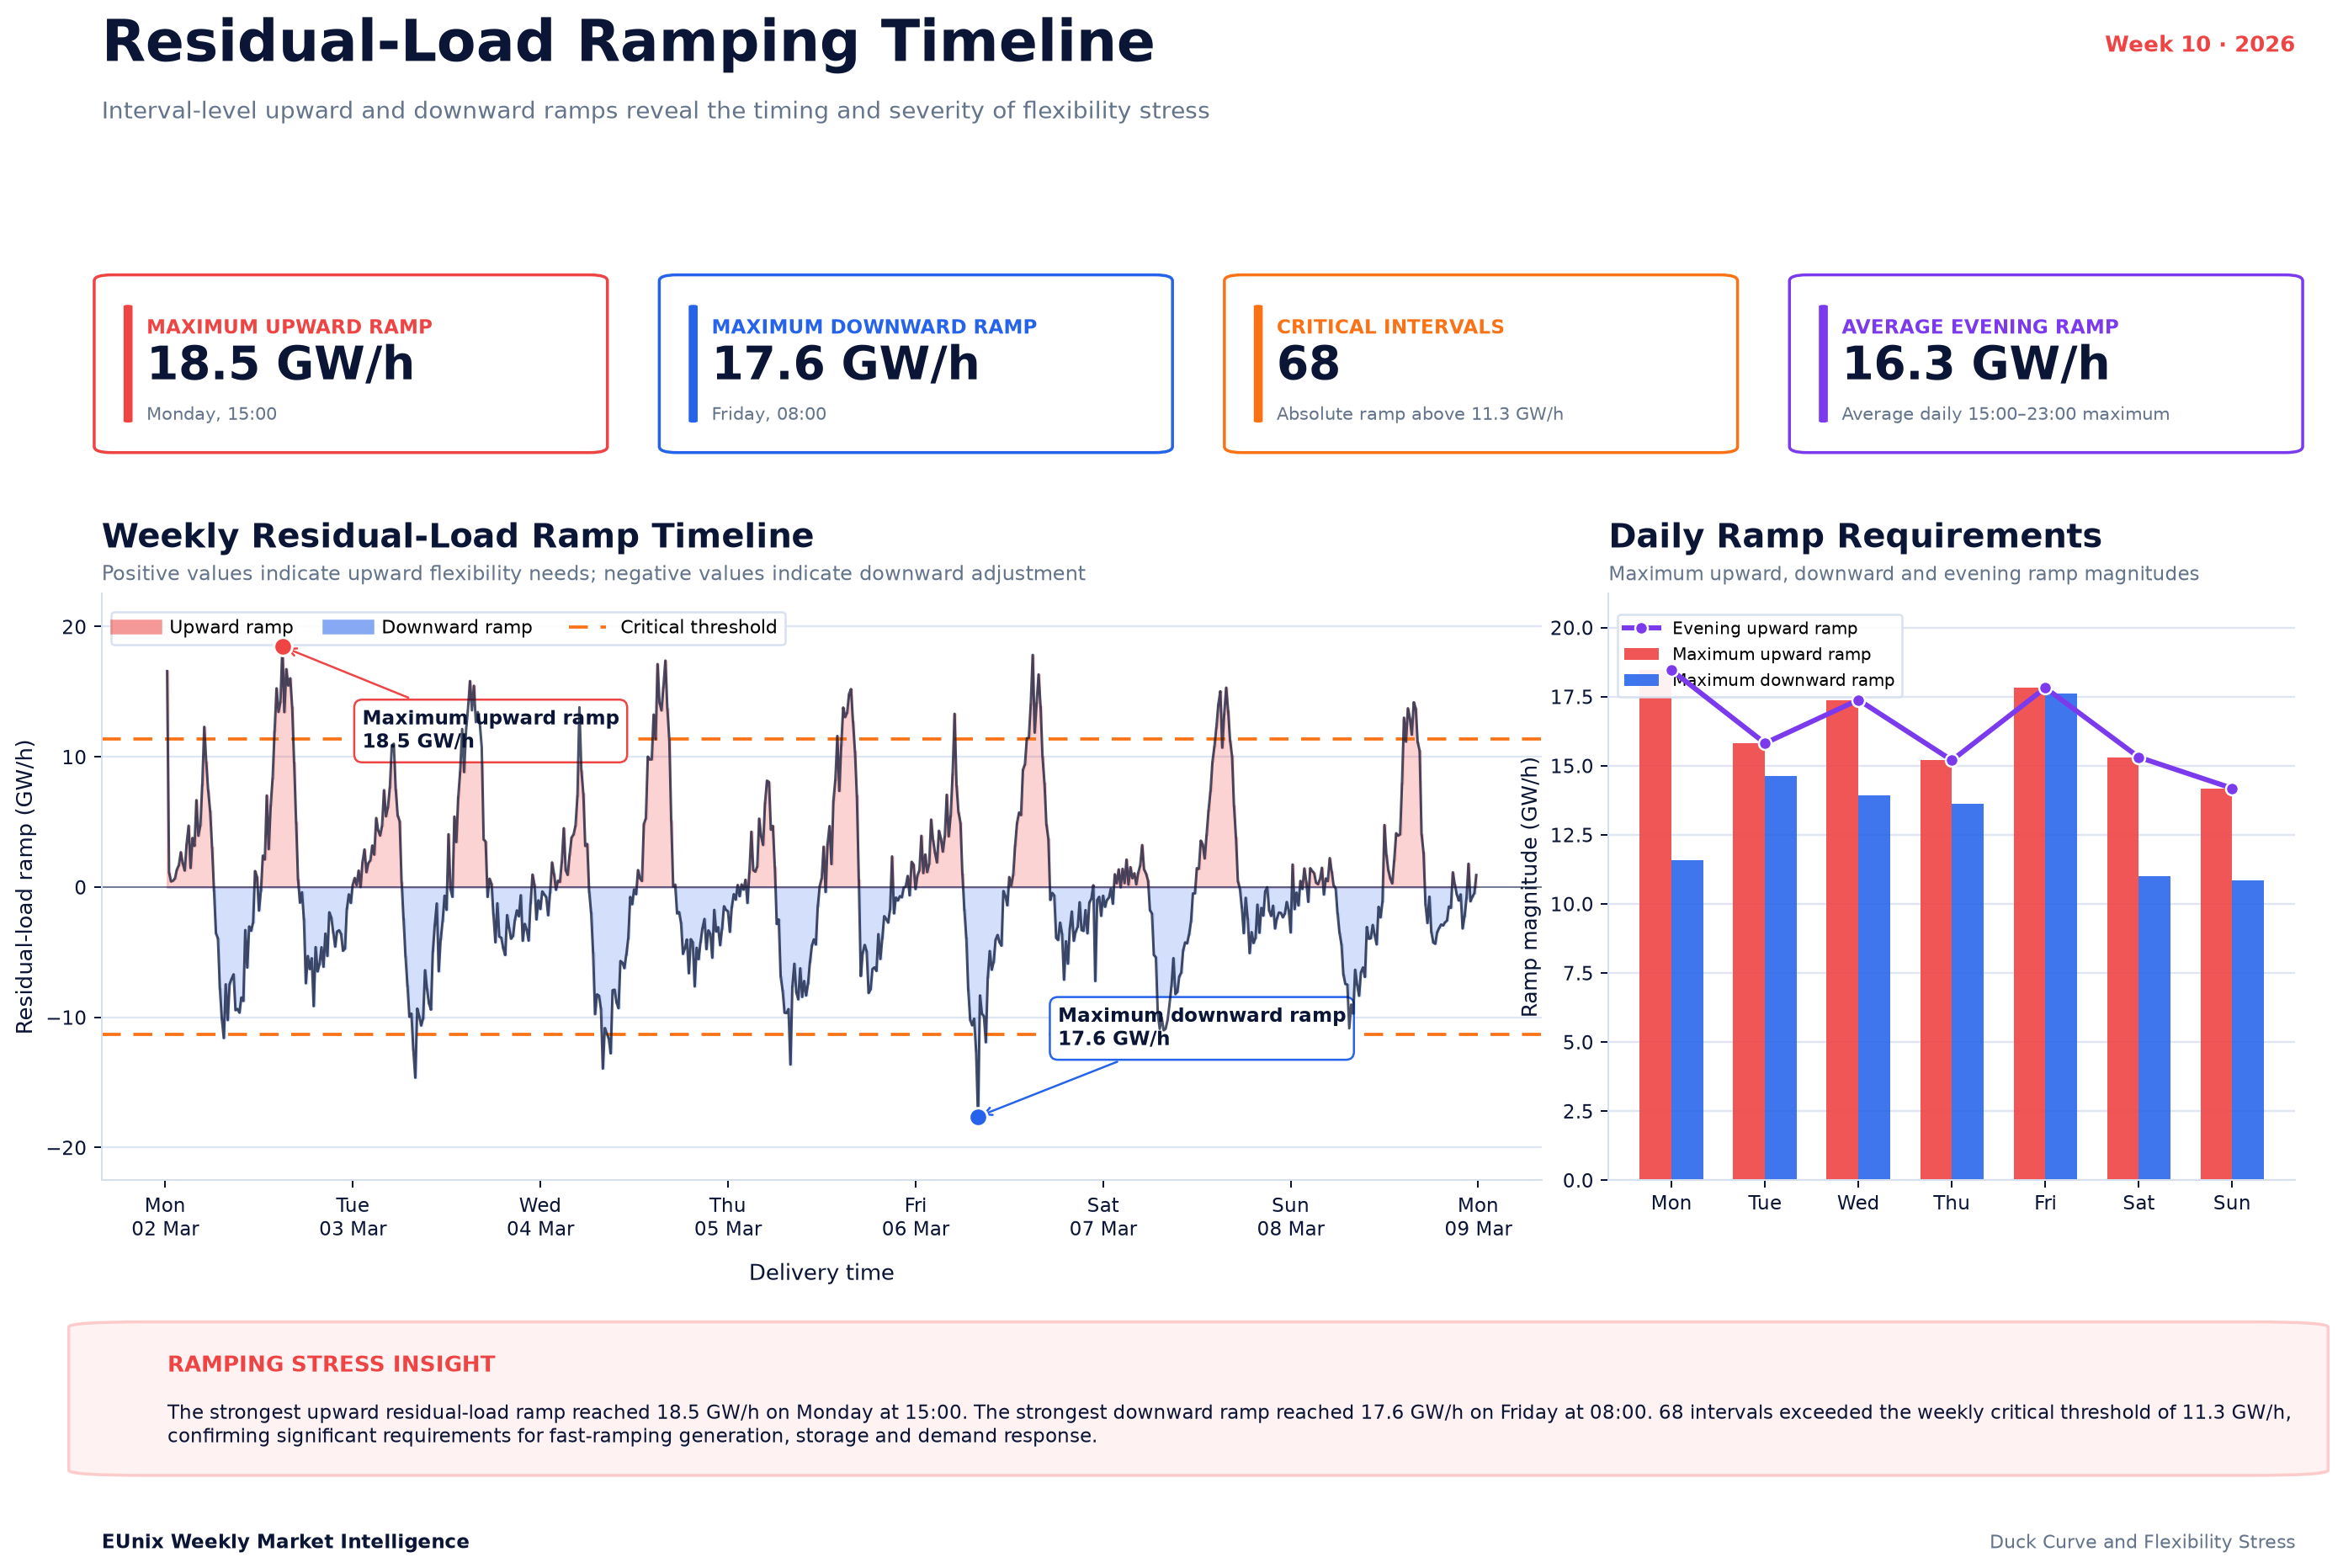
The interval-level data strengthen this interpretation. Upward ramps reached 18.5 GW/h, downward ramps reached 17.6 GW/h, and critical ramp conditions appeared throughout the reporting week. Flexibility stress was therefore not confined to one exceptional afternoon.
The Week 10 pattern also reveals the complementary role of storage and demand response. Low residual-load periods create potential charging windows, while steep afternoon recovery increases the value of rapid discharge or consumption reduction.
This is precisely why growing renewable penetration increasingly shifts the system challenge from simply providing enough energy to providing enough flexibility at the right time.
Revenue Insight
Market Outlook
Future periods combining deep midday residual-load troughs with rapid late-afternoon recovery would continue to strengthen the value proposition for battery storage, demand response, flexible generation, smart EV charging and cross-border flexibility.
Particular attention should be paid to the relationship between renewable output and the late-afternoon ramp. If renewable penetration continues increasing while flexible capacity does not expand at a similar pace, the operational importance of these ramps is likely to grow.
The key indicators to monitor are therefore daily duck depth, minimum residual load, evening recovery, upward and downward ramp rates, critical-ramp frequency, storage-opportunity windows and demand-response signals.
The broader Week 10 message is clear: higher renewable generation does not remove the need for controllable resources. Instead, it changes when and how quickly those resources are needed, increasing the strategic value of flexibility across the electricity system.
Simulation Note
Written by
Dr. G. O. C. Okwuibe
Quantitative Energy Systems Expert | Electricity Market & BESS
Dr. Godwin Okwuibe is a quantitative energy system expert specializing in electricity markets, battery storage optimization, and flexibility market design. His work focusses on translating complex market dynamics into actionable insights for industry stakehold...