
 Dr. G. O. C. Okwuibe
Duck Curve and Flexibility Stress — Week 15, 2026
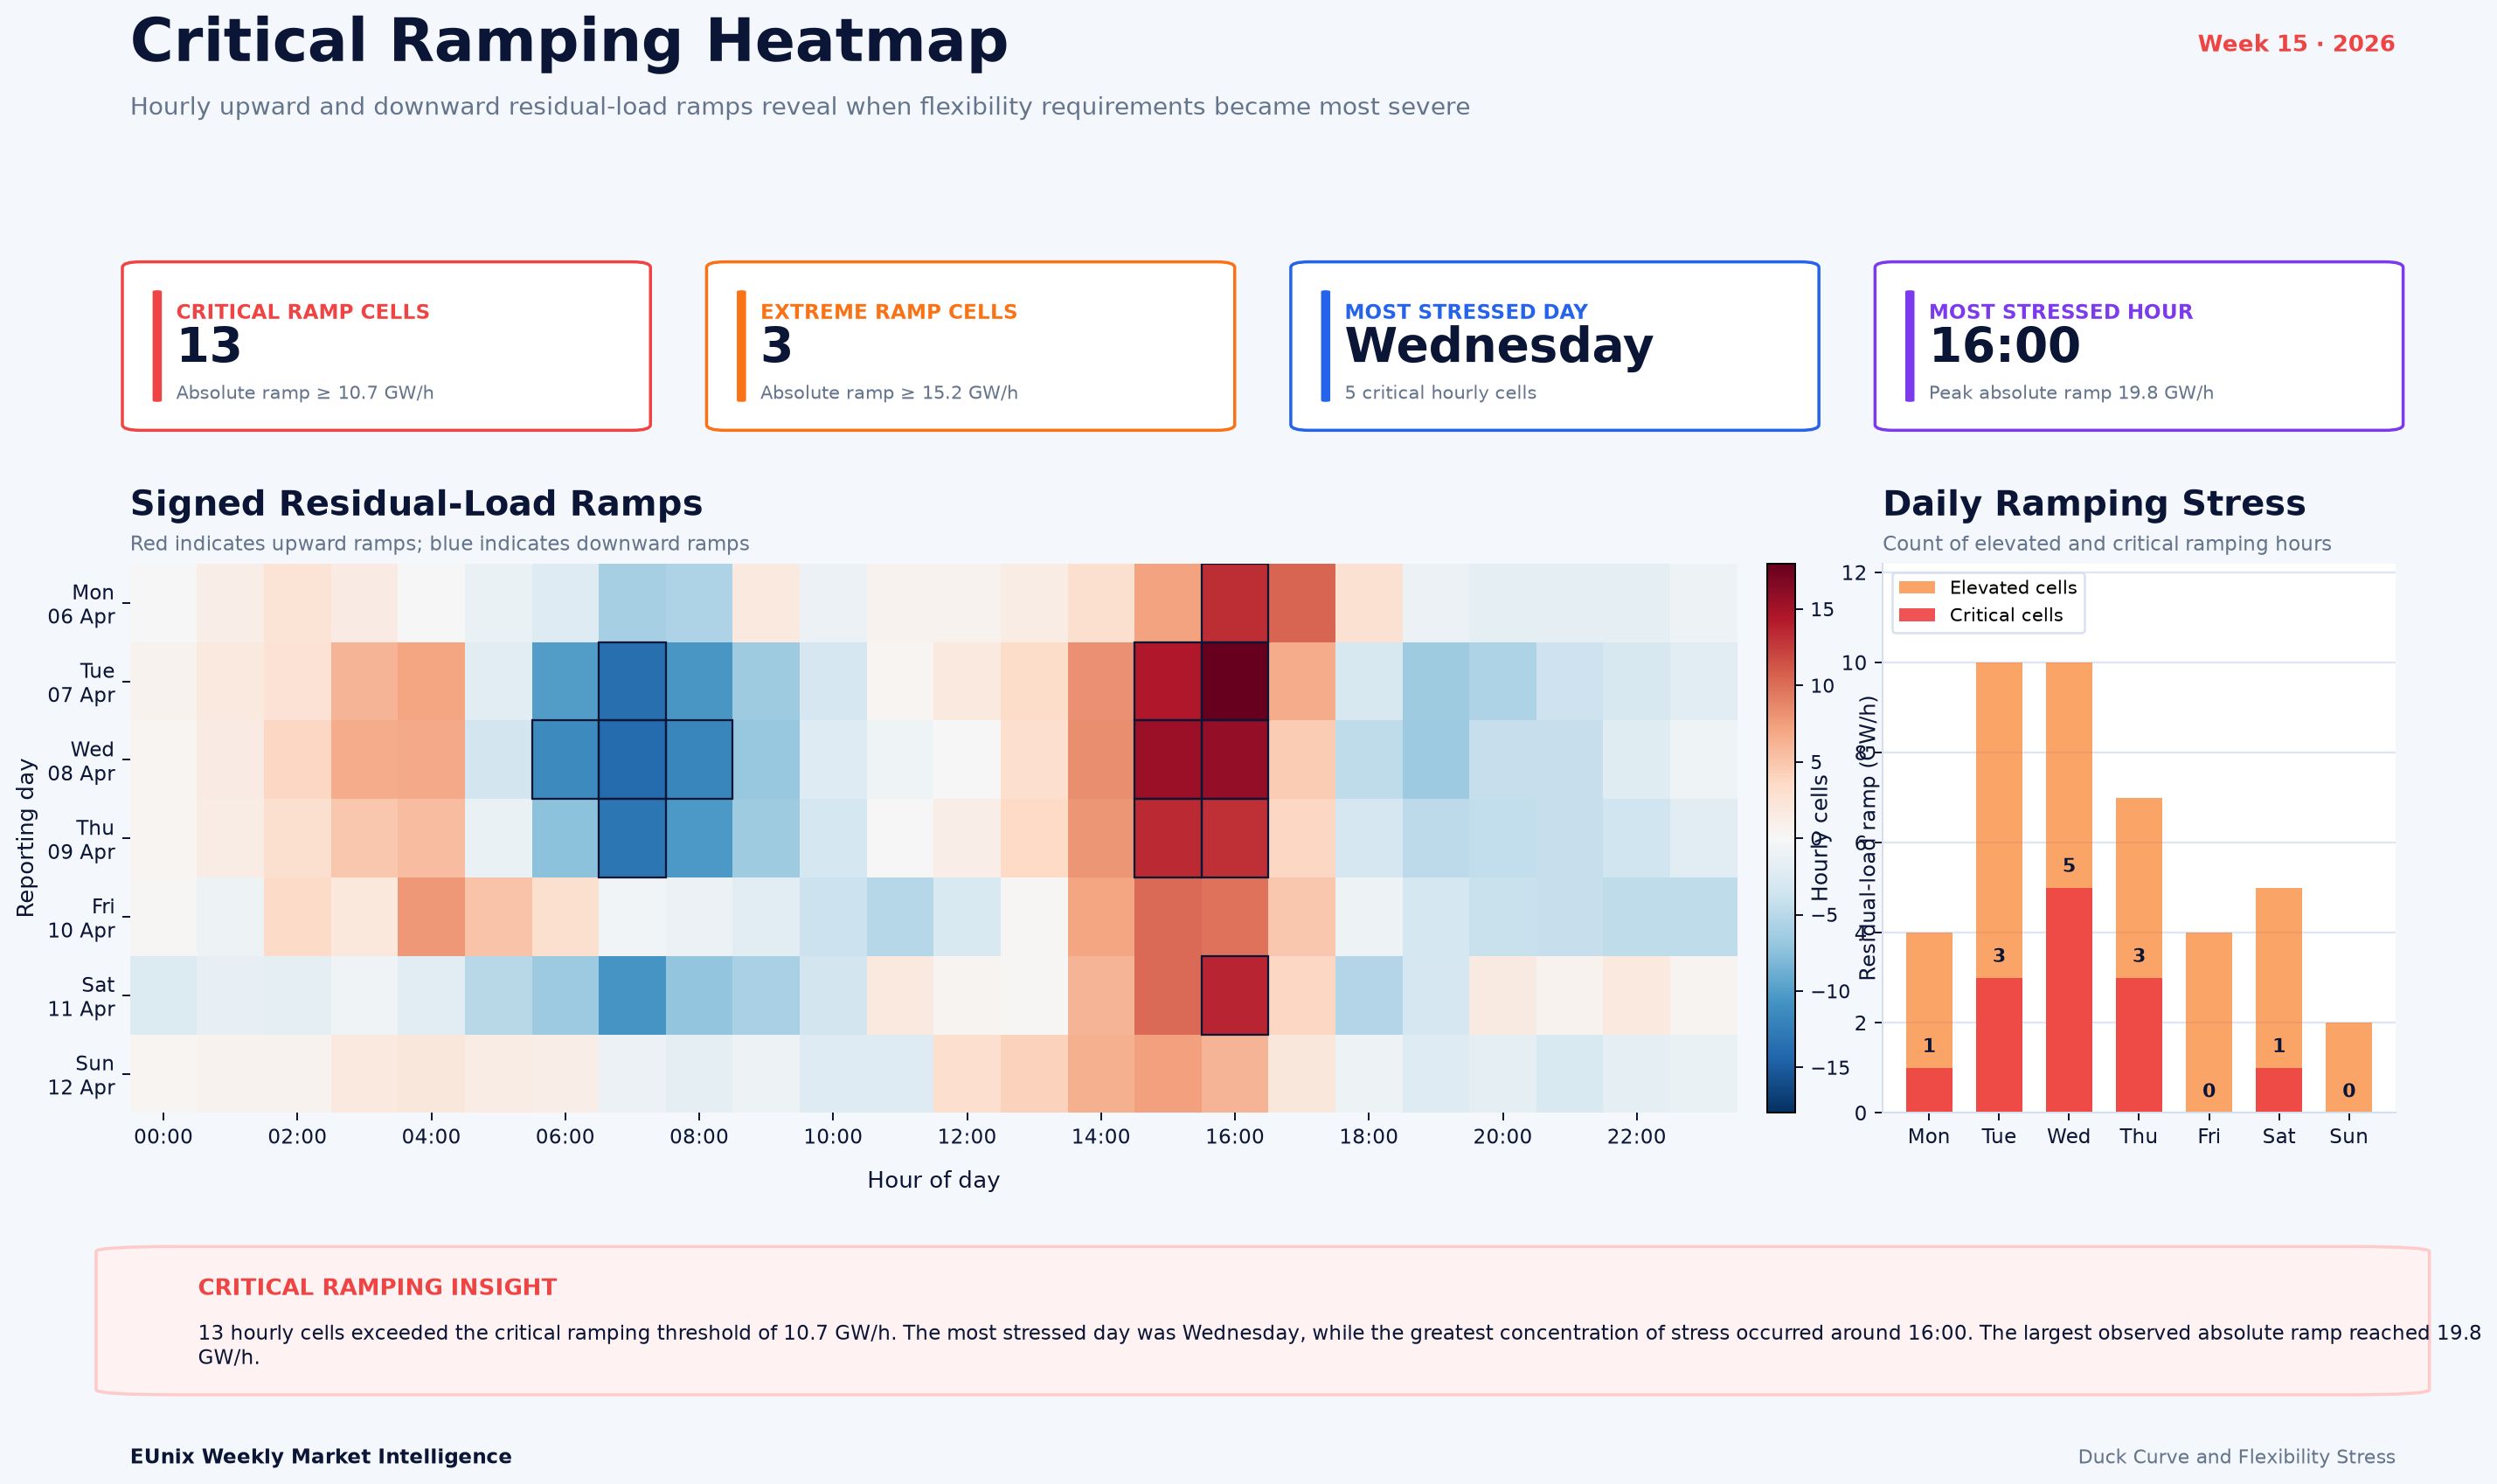
Germany experienced a pronounced flexibility event during Week 15, with residual-load conditions producing a 53.0 GW duck-curve depth, an evening recovery of 35.7 GW, and 68 critical residual-ramp intervals. EUnix Market Intelligence ranked the story with a priority score of 90.63, highlighting the growing operational value of storage, demand response and fast-ramping resources.
Charts
Market Overview
The story received a priority score of 90.63, supported by a very strong detection strength of 96.44% and confidence of 85.26%.
The dominant signal was a maximum duck-curve depth of 53,030.8 MW. The maximum evening ramp reached 35,712.9 MW, while 68 intervals were classified as critical residual-load ramp events.
The supporting analytics reinforce the signal. Duck-curve intensity scored 93.86, followed by demand-response opportunity at 90.86, ramping at 85.67, and storage utilisation at 65.42.
The charts also show a distinct intraday pattern. Average electricity demand was around 50.8 GW, renewable generation averaged 28.4 GW, and average residual load fell to 22.4 GW. Renewable penetration reached as high as 77.1% on Saturday.
Key Observations
Interpretation
The daily system profile makes this particularly clear. Renewable generation rises sharply during the morning, approaches roughly 50 GW around the midday period, and substantially reduces residual demand. Later in the afternoon, renewable output declines while electricity demand remains relatively high, forcing residual load upward again.
This creates the classic duck-curve problem.
The Week 15 event was especially significant because residual load did not merely fall to a low positive level. It became negative during some periods, meaning renewable generation exceeded underlying demand before other balancing actions were considered.
This changes the flexibility challenge in two directions.
During the low-residual-load period, the system needs assets capable of absorbing or shifting surplus electricity. Storage charging, flexible industrial demand, EV charging and other controllable loads become valuable.
Several hours later, the system faces the opposite problem. As renewable production falls, tens of gigawatts of residual demand can return quickly, increasing the need for storage discharge, flexible generation, imports and responsive consumption.
The combination of a 53 GW story-level duck depth, large evening recovery, negative residual load and repeated critical ramps therefore represents more than a visually interesting daily demand profile. It is a substantial system-flexibility event.
Revenue Insight
Market Outlook
Week 15 provides several signals worth monitoring closely in subsequent weeks: midday residual-load minima, renewable share, evening recovery magnitude, critical ramp frequency, storage-opportunity hours and demand-response conditions.
If renewable output continues to push residual demand close to or below zero while evening demand remains elevated, the value of flexibility is likely to increase.
The most important structural question is therefore not simply how much renewable generation is installed, but how effectively the system can move electricity and consumption across time.
Storage, demand response, flexible generation, interconnection and smart charging can all help flatten the residual-load profile.
For investors and operators, Week 15 reinforces an increasingly important market principle: high-renewable electricity systems require not only energy capacity, but substantial temporal flexibility.
Simulation Note
Written by
Dr. G. O. C. Okwuibe
Quantitative Energy Systems Expert | Electricity Market & BESS
Dr. Godwin Okwuibe is a quantitative energy system expert specializing in electricity markets, battery storage optimization, and flexibility market design. His work focusses on translating complex market dynamics into actionable insights for industry stakehold...