Dr. G. O. C. Okwuibe Dr. G. O. C. Okwuibe
All Reports / Week 17, 2026
Intelligence Report W17 · 2026 Dr. G. O. C. Okwuibe 27 Apr 2026

Duck Curve and Flexibility Stress — Week 17, 2026

Germany experienced another pronounced flexibility-stress week as renewable generation depressed residual demand around midday before steep evening recovery. EUnix Market Intelligence detected a 49.46 GW maximum duck depth, a 37.61 GW maximum evening-ramp signal, and 68 critical residual-ramp intervals, highlighting strong requirements for storage, demand response and fast-ramping resources.

📈
Chart
📊
EUnix Market Intelligence identified Duck Curve and Flexibility Stress as the selected market story for ISO Week 17, covering 20–26 April 2026.

The story received a priority score of 89.03, supported by a very strong detection strength of 95.69% and confidence of 81.52%.

The dominant story-level signal was a maximum duck-curve depth of 49,463.1 MW, accompanied by a maximum evening-ramp indicator of 37,611.5 MW and 68 critical residual-ramp intervals.

Supporting analytics were also strong. Duck curve scored 93.74, closely followed by demand-response opportunity at 93.16. Ramping scored 75.15, while storage utilisation scored 60.97.

The underlying system profile helps explain the event. Average electricity demand reached 51.9 GW, renewable generation averaged 31.7 GW, and average residual load fell to 20.2 GW. The highest daily renewable share reached 82.4% on Saturday, creating substantial periods in which renewable production displaced conventional residual demand.
🔍
1 The story-level maximum duck depth reached 49.46 GW, confirming a substantial intraday difference between high and low residual-load conditions.
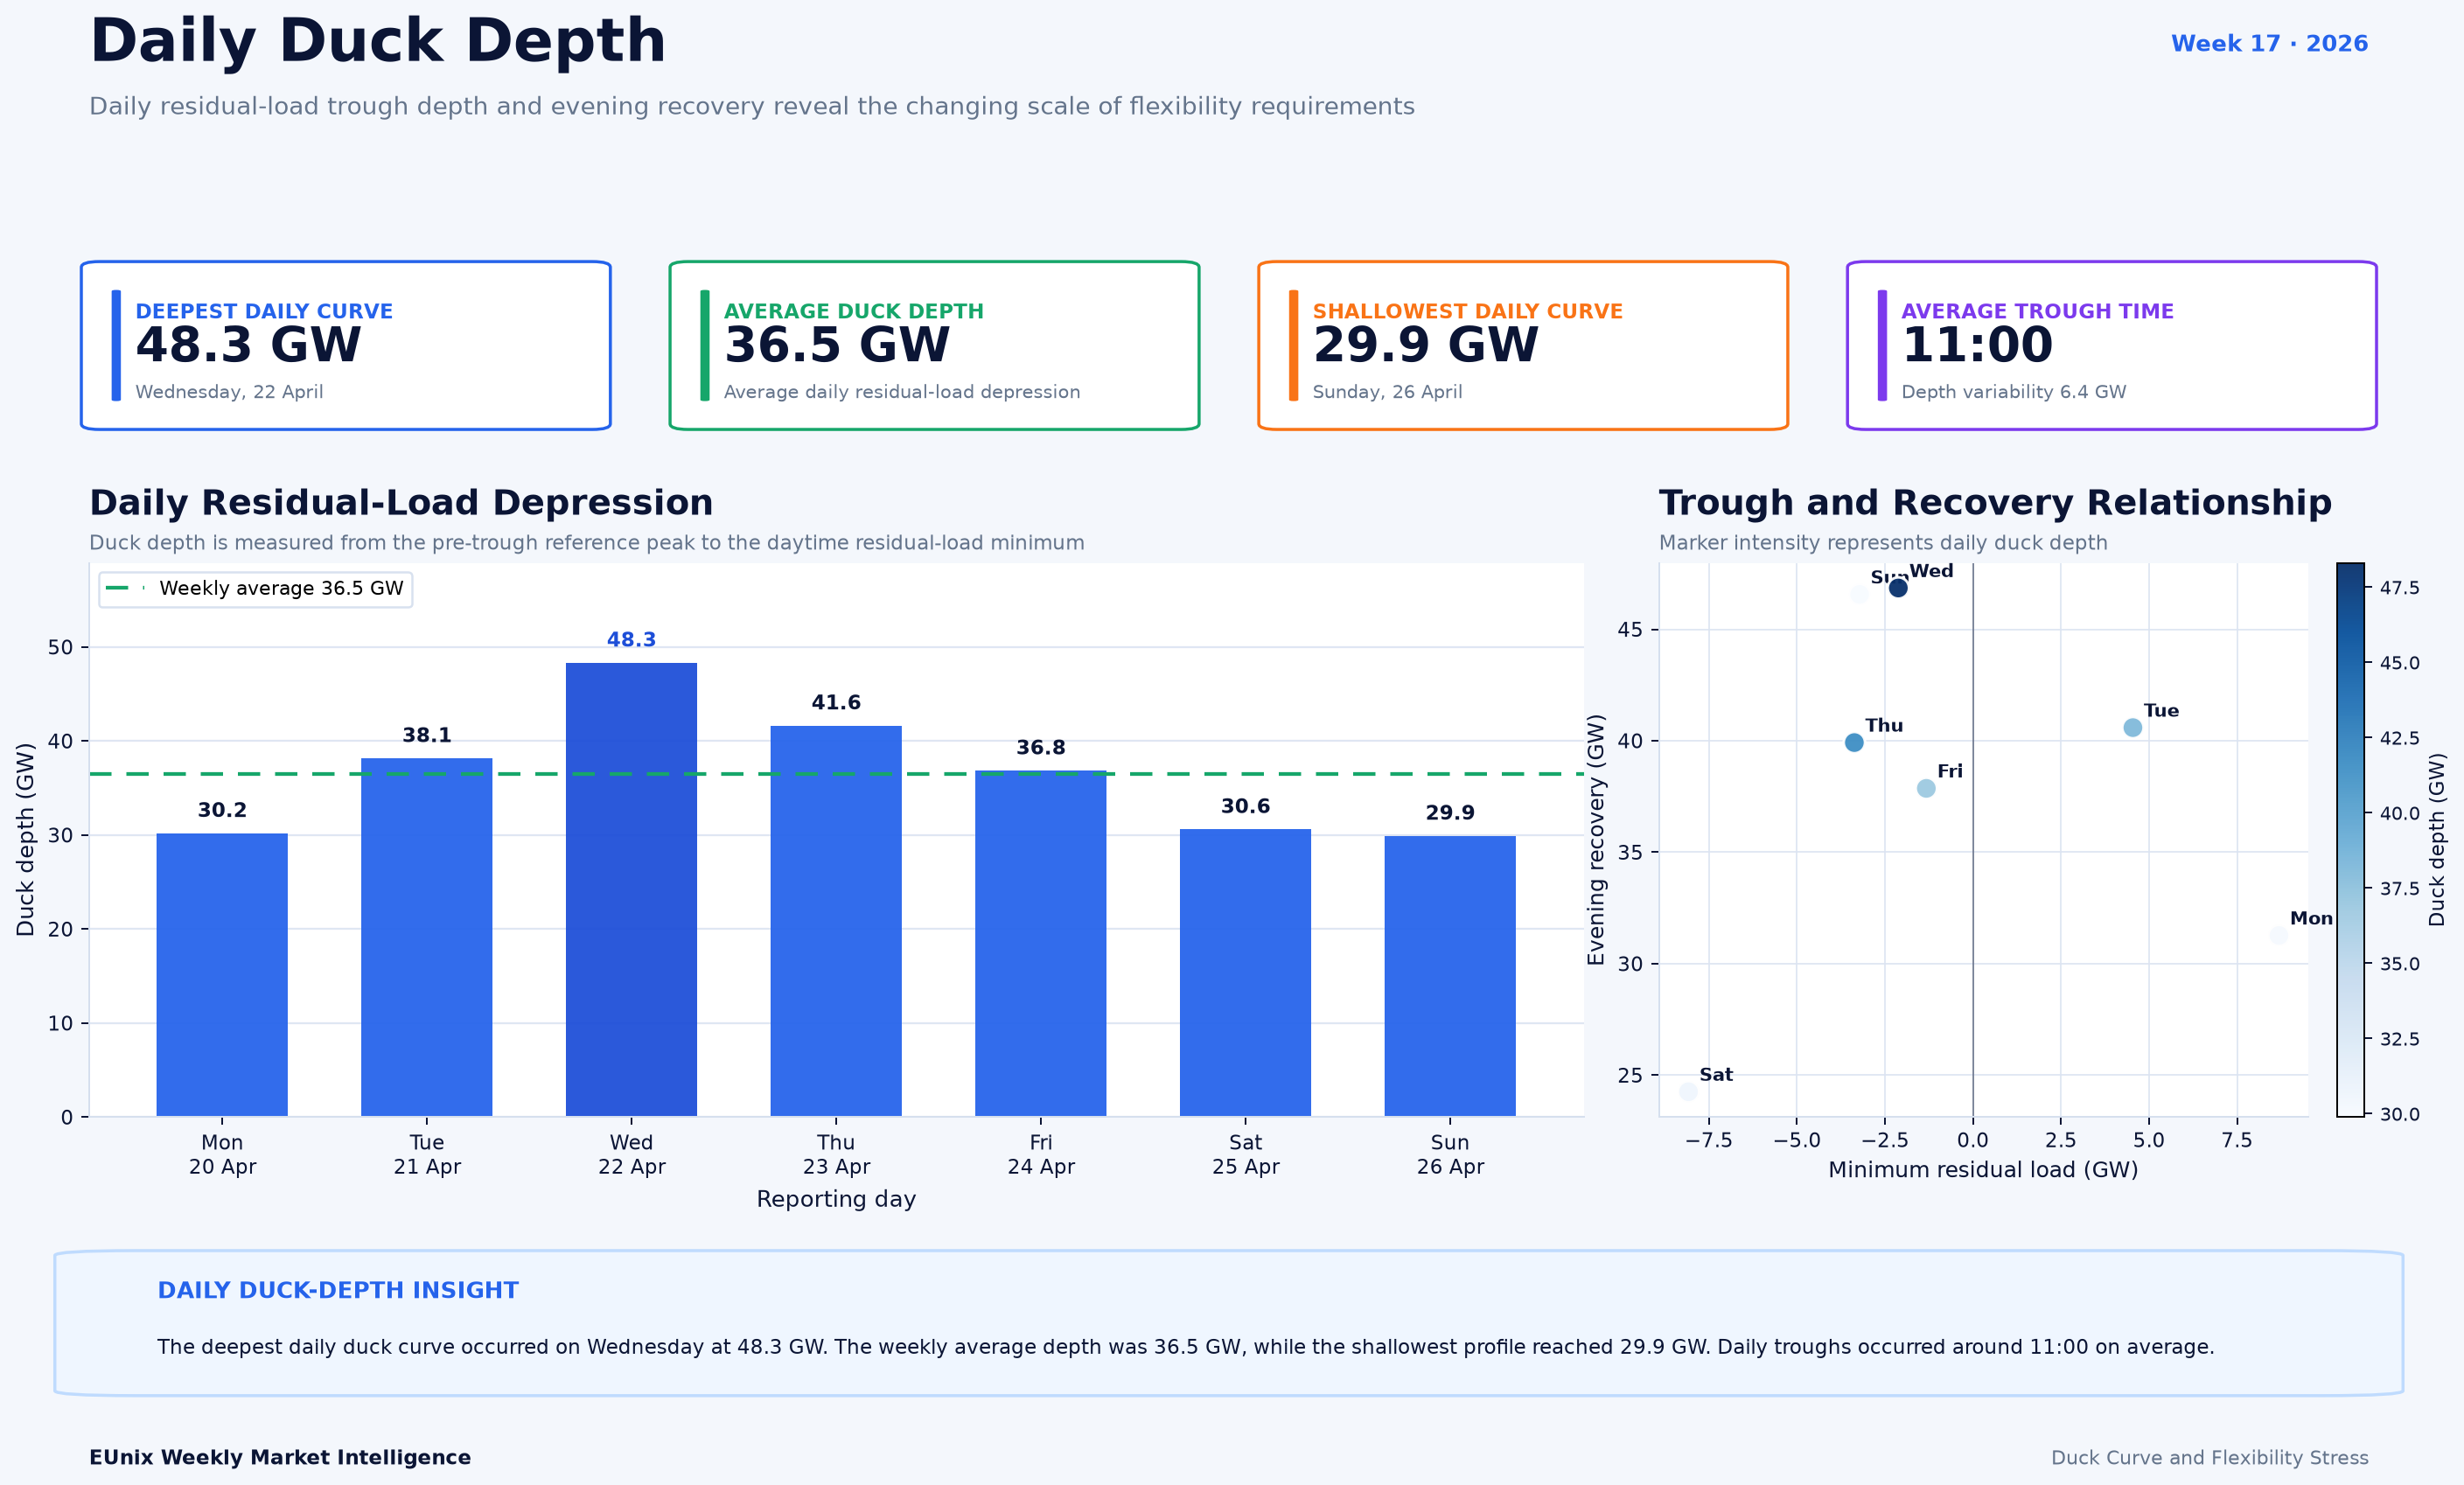
2 The daily-profile analysis identified Wednesday, 22 April as the deepest individual daily duck curve at approximately 48.3 GW. Its residual-load minimum fell below zero, illustrating how renewable output could temporarily exceed the residual demand requirement.
3 Across the week, average daily duck depth was approximately 36.5 GW. Even the shallowest daily profile reached about 29.9 GW, indicating that pronounced intraday residual-load variation was not confined to a single exceptional day.
4 Daily residual-load troughs occurred at approximately 11:00 on average, establishing a recurring midday window during which system flexibility and storage charging became particularly relevant.
5 The detailed daily-profile analysis showed an evening recovery of approximately 46.9 GW on Wednesday. This chart-level daily recovery metric differs from the 37.61 GW story-level evening-ramp indicator, reflecting different analytical definitions and aggregation windows.
6 Interval-level ramp analysis recorded maximum upward and downward residual-load ramps of approximately 19.4 GW/h.
7 68 intervals breached the story's critical residual-ramp criteria. In the hourly heatmap aggregation, 14 hourly cells exceeded the 10.6 GW/h critical threshold and four reached the extreme category.
8 Thursday was classified as the most stressed day in the critical-ramping heatmap, while the greatest hourly stress concentration occurred around 16:00.
9 The flexibility-opportunity analysis identified 42 hours of strong storage-charging conditions and 42 hours of strong demand-response conditions using the chart's top-quartile opportunity definition.
🧠
Week 17 illustrates a central challenge of renewable-rich electricity systems: the system can move rapidly from conditions of abundant renewable generation to conditions requiring a substantial increase in dispatchable supply or reduced demand.

The average intraday profile makes this particularly clear.

Renewable generation increased strongly through the morning and approached system demand around midday. Consequently, average residual load fell to approximately zero around the late-morning period before recovering sharply as renewable production declined.

That pattern fundamentally changes the nature of system adequacy.

The operational challenge is no longer simply whether enough generation capacity exists. Increasingly, the important question is whether enough flexibility exists to move the system efficiently between substantially different operating states.

The Wednesday profile provides a strong example. A deep midday trough was followed by a major evening recovery, requiring the power system to absorb renewable production earlier in the day and then rapidly replace declining renewable output later.

This is precisely where batteries, flexible industrial loads, demand response, interconnectors and fast-ramping generation become valuable.

The repeated nature of the event is equally important. With 68 critical residual-ramp intervals, Week 17 was not driven by one isolated extreme movement. Flexibility requirements recurred throughout the reporting period.
💰
Duck-curve conditions create several potential value pools for flexible assets, but the presence of system stress does not automatically imply realised commercial revenue. For battery storage, the most obvious opportunity is temporal energy shifting: charging when residual load is depressed and renewable production is abundant, then discharging when residual demand recovers. Week 17 contained 42 hours classified as strong storage-opportunity conditions under the broader top-quartile methodology. The strongest individual storage signal reached 80.8/100, while the stricter flexibility dashboard identified 3.8 hours above the 75/100 high-value threshold. Demand-side flexibility also appeared particularly relevant. Demand response scored 93.16 in the story analytics, almost matching the duck-curve score itself, while the peak demand-response signal reached 81.4/100. This suggests that the flexibility requirement was not exclusively a storage story. Flexible consumption could potentially help by increasing electricity use during renewable-rich trough periods or reducing consumption during rapid evening recovery. However, these are technical opportunity signals rather than realised revenue figures. Actual battery or demand-response revenue would depend on whether the identified flexibility stress coincided with wholesale price spreads, balancing prices, congestion signals or other market mechanisms through which flexibility could be monetised. The next commercial question is therefore not simply how much flexibility was required? but how much of that requirement translated into captureable market value?
🔭
The Week 17 indicators reinforce the importance of monitoring the interaction between renewable generation, residual load and ramping requirements rather than considering renewable penetration in isolation.

Future periods with deeper midday residual-load reductions combined with rapid afternoon or evening recovery would strengthen the value proposition for storage, flexible demand and fast-ramping resources.

Particular attention should be paid to residual-load trough depth, evening recovery magnitude, critical ramp frequency, renewable share, wholesale price spreads and balancing-market conditions.

The highest daily renewable share already reached 82.4% during Week 17. If similar renewable penetration coincides with low demand, deeper or more frequent negative residual-load periods could emerge.

For investors and operators, the broader message remains important: as renewable penetration increases, flexibility becomes an increasingly valuable system resource — but the commercial opportunity depends on translating that physical requirement into market-accessible revenue streams.
🔬
All underlying electricity-market and power-system data used in this analysis were sourced from the ENTSO-E Transparency Platform. Data processing, analytics, event detection, scoring, residual-load analysis, flexibility assessment, visualisation and market interpretation were performed using the EUnix Nexus Market Intelligence framework.
Dr. G. O. C. Okwuibe

Written by

Dr. G. O. C. Okwuibe

Quantitative Energy Systems Expert | Electricity Market & BESS

Dr. Godwin Okwuibe is a quantitative energy system expert specializing in electricity markets, battery storage optimization, and flexibility market design. His work focusses on translating complex market dynamics into actionable insights for industry stakehold...

View full profile