
 Dr. G. O. C. Okwuibe
From €459.6/MWh to Negative Prices: Battery Flexibility Captured a €411/MWh Weekly Spread — Week 23, 2026
Germany’s wholesale market produced a powerful storage signal in ISO Week 23. Prices ranged from €459.6/MWh to -€24.8/MWh, while the largest daily arbitrage spread reached €411.4/MWh. EUnix ranked Battery Arbitrage Opportunity first for the week with a 95.66 priority score, 98.4 detection strength and 94.04% confidence, supported by recurring charging and discharging windows across the reporting period.
Charts
Market Overview
The strongest analytical component was battery_opportunity at 98.06, closely followed by price_volatility at 96.36. negative_price also remained strongly relevant at 83.67, confirming that the opportunity was supported by both large price dispersion and periods of exceptionally low electricity prices.
Wholesale electricity averaged €96.7/MWh during the week, but this average concealed extreme intraday variation. The highest observed price reached €459.6/MWh, while the weekly minimum fell to -€24.8/MWh. The largest daily charging-to-discharging spread was €411.4/MWh, recorded on Monday.
The dedicated arbitrage-spread analysis shows substantial opportunities beyond the Monday extreme. Friday produced a daily spread slightly above €200/MWh, while Saturday was around €195/MWh. Even the week's lowest daily spread, on Thursday, remained approximately €126.3/MWh.
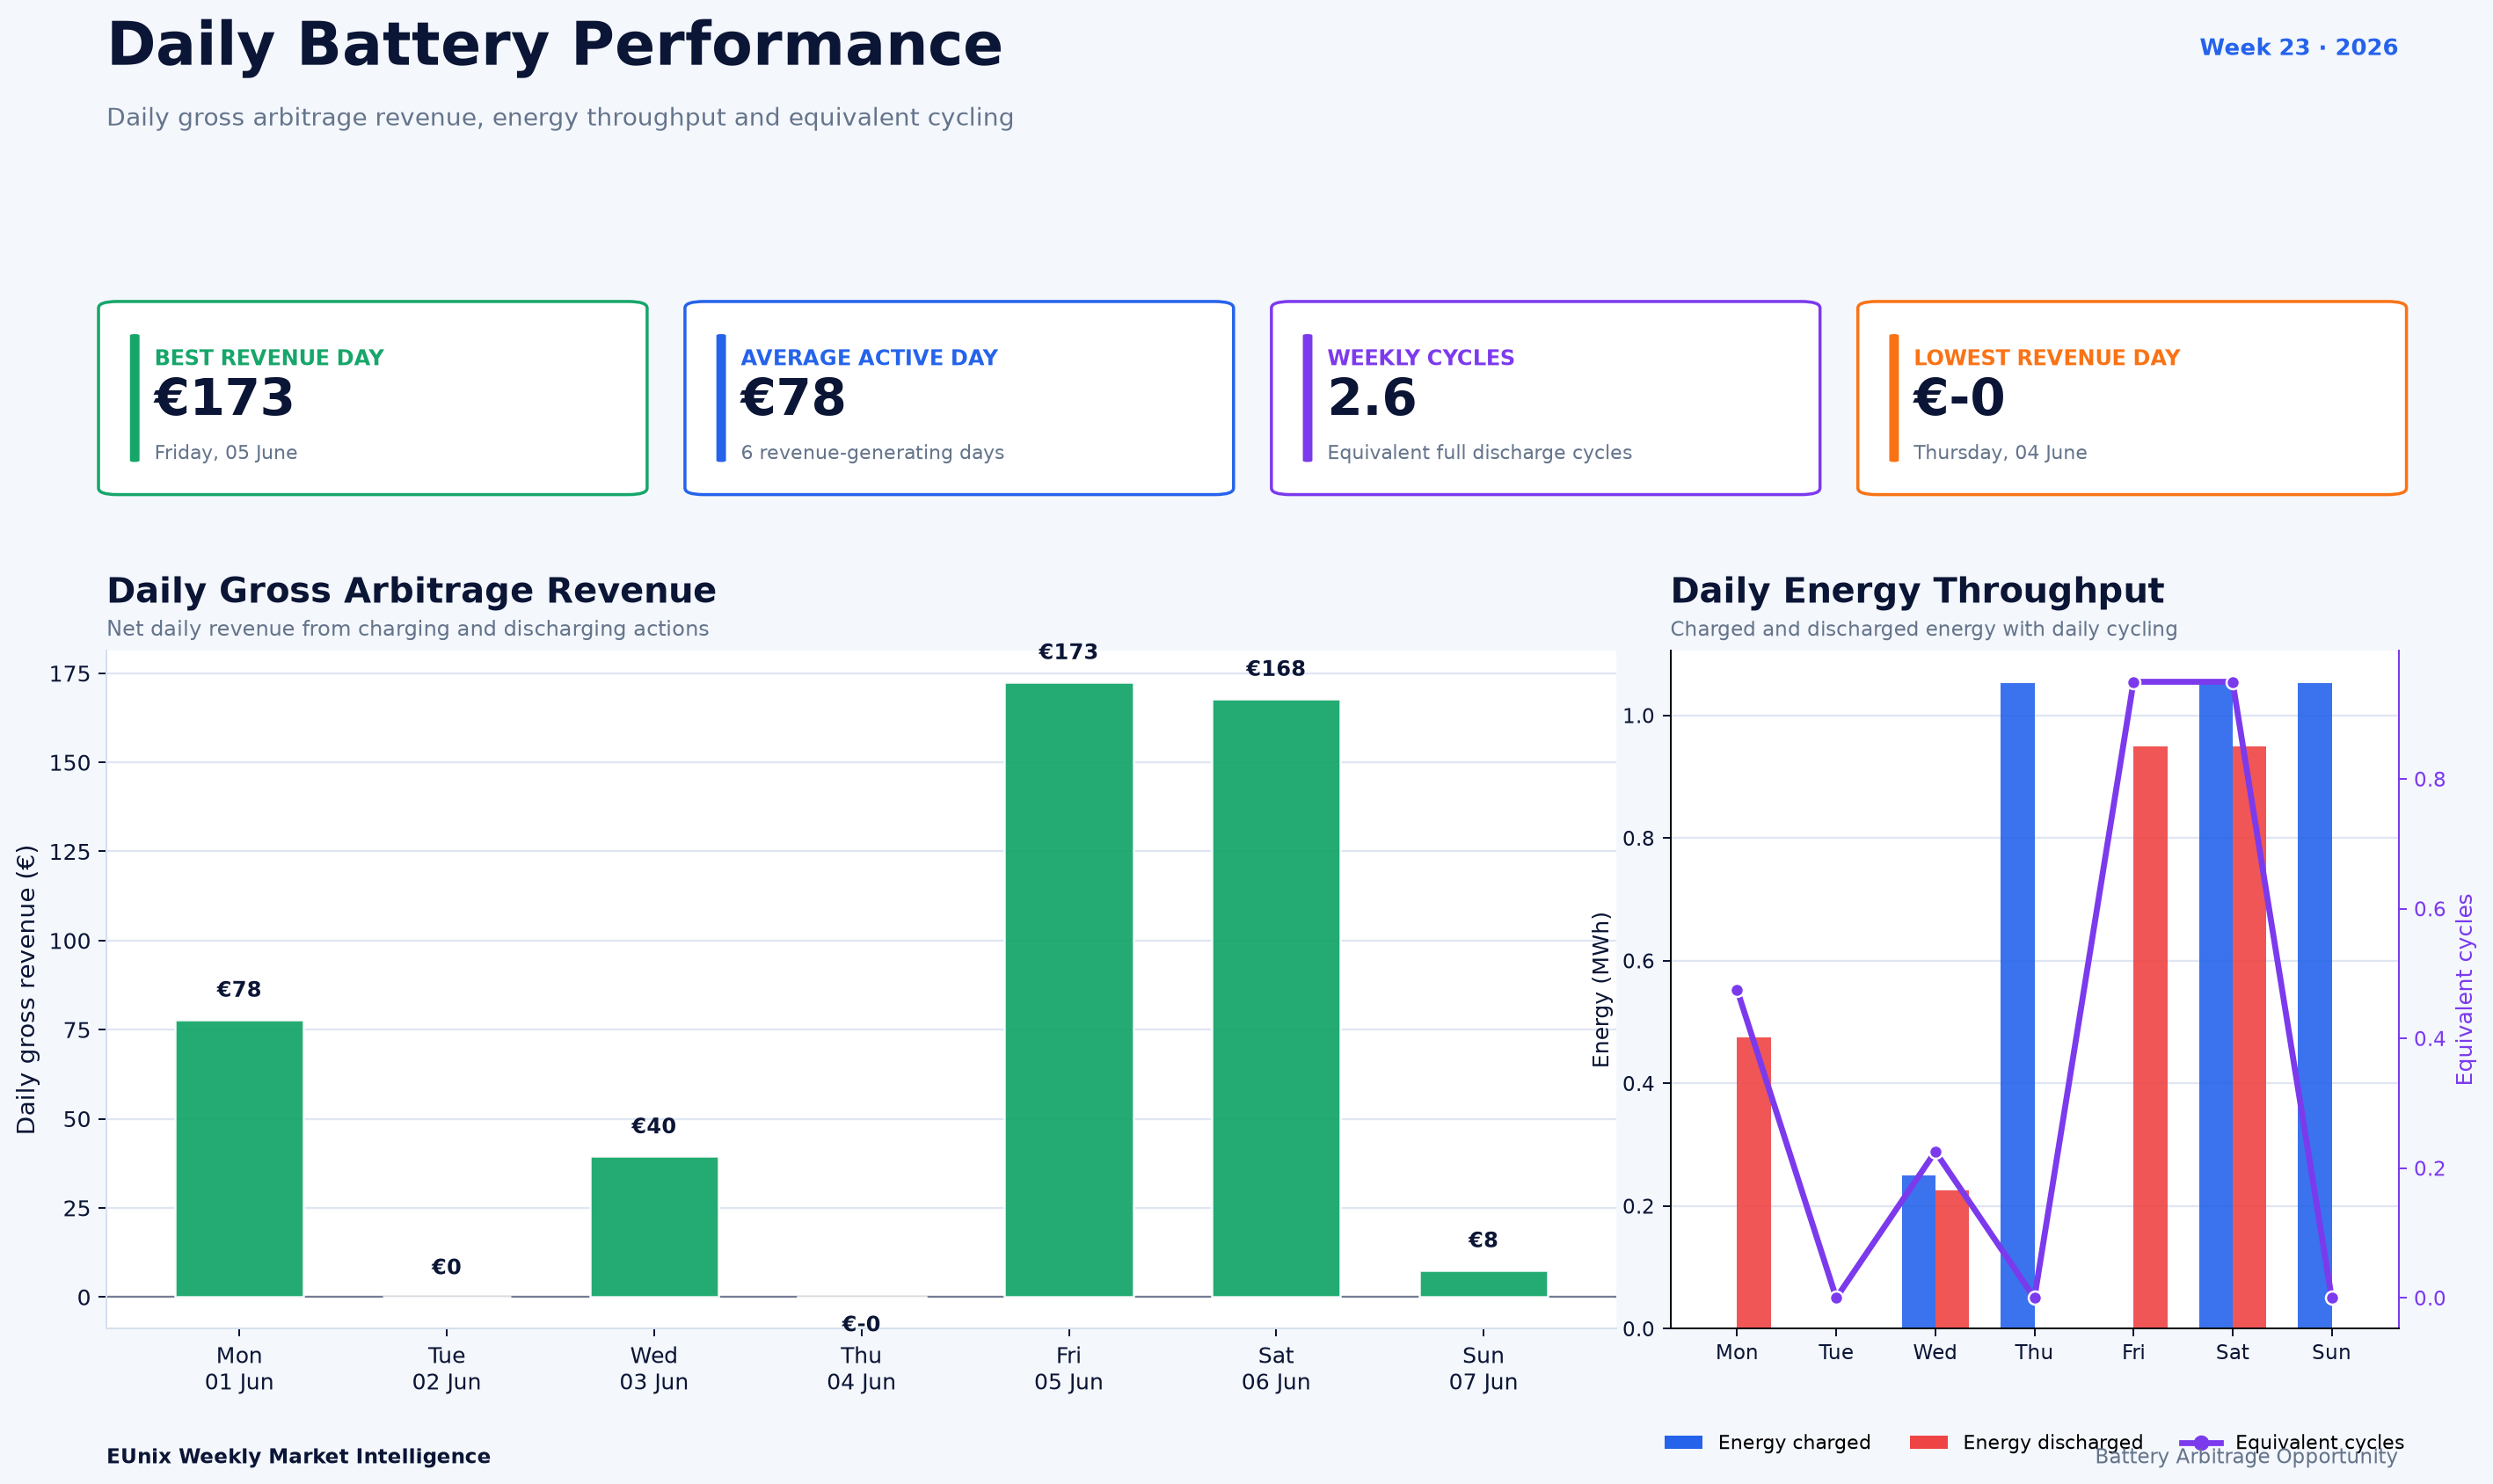
The illustrative 1 MW / 1 MWh battery simulation generated €465 gross weekly revenue, discharged 2.60 MWh, charged 3.41 MWh, and completed 2.6 equivalent cycles.
Key Observations
Interpretation
For battery assets, that dispersion is the important feature. The market repeatedly moved from low or negative-price conditions into substantially higher-price windows, generating opportunities to transfer electricity across time rather than simply respond to the absolute price level.
Monday illustrates the most extreme version of this dynamic. The weekly price curve contains the highest price of €459.6/MWh, while the daily arbitrage analysis reports a €411.4/MWh spread. Yet the opportunity was broader than Monday: recurring low-price charging windows remained visible later in the week, particularly as prices approached or moved below zero.
The battery-opportunity timeline reinforces this interpretation. Green charging windows and red discharging windows are temporally separated across several days, producing recognisable cycles in which storage could absorb electricity during low-value periods and release it during stronger price periods.
The analytical rankings also matter. battery_opportunity and price_volatility both scored above 96, while negative_price remained above 83. Week 23 was therefore not merely a negative-price story; it was a price-separation story, where volatility created value from moving energy between distinct market periods.
Revenue Insight
Market Outlook
Negative prices are useful to storage, but they are not necessary for arbitrage value. Week 23 shows this clearly: the week's strongest signal came from the €411.4/MWh daily spread, while several other days still offered material spreads without matching the Monday extreme.
The frequency of strong-opportunity periods also matters. The 34 identified strong opportunity hours suggest meaningful optionality across the week, which can be more valuable operationally than depending on a single exceptional event.
Future analysis should therefore watch three supplied indicators together: daily price spread, duration of charging/discharging windows and realised dispatch spread. A high theoretical spread is most commercially relevant when the battery can physically capture both sides of the price movement.
Week 23 ultimately shows a market where storage value came from timing rather than average price: electricity became sufficiently cheap during some intervals and sufficiently valuable during others for flexible energy shifting to become the week's dominant EUnix market intelligence story.
Simulation Note
Written by
Dr. G. O. C. Okwuibe
Quantitative Energy Systems Expert | Electricity Market & BESS
Dr. Godwin Okwuibe is a quantitative energy system expert specializing in electricity markets, battery storage optimization, and flexibility market design. His work focusses on translating complex market dynamics into actionable insights for industry stakehold...