
 Dr. G. O. C. Okwuibe
From €529 Price Spikes to Near-Zero Electricity: Battery Arbitrage Takes Centre Stage — Week 41, 2026
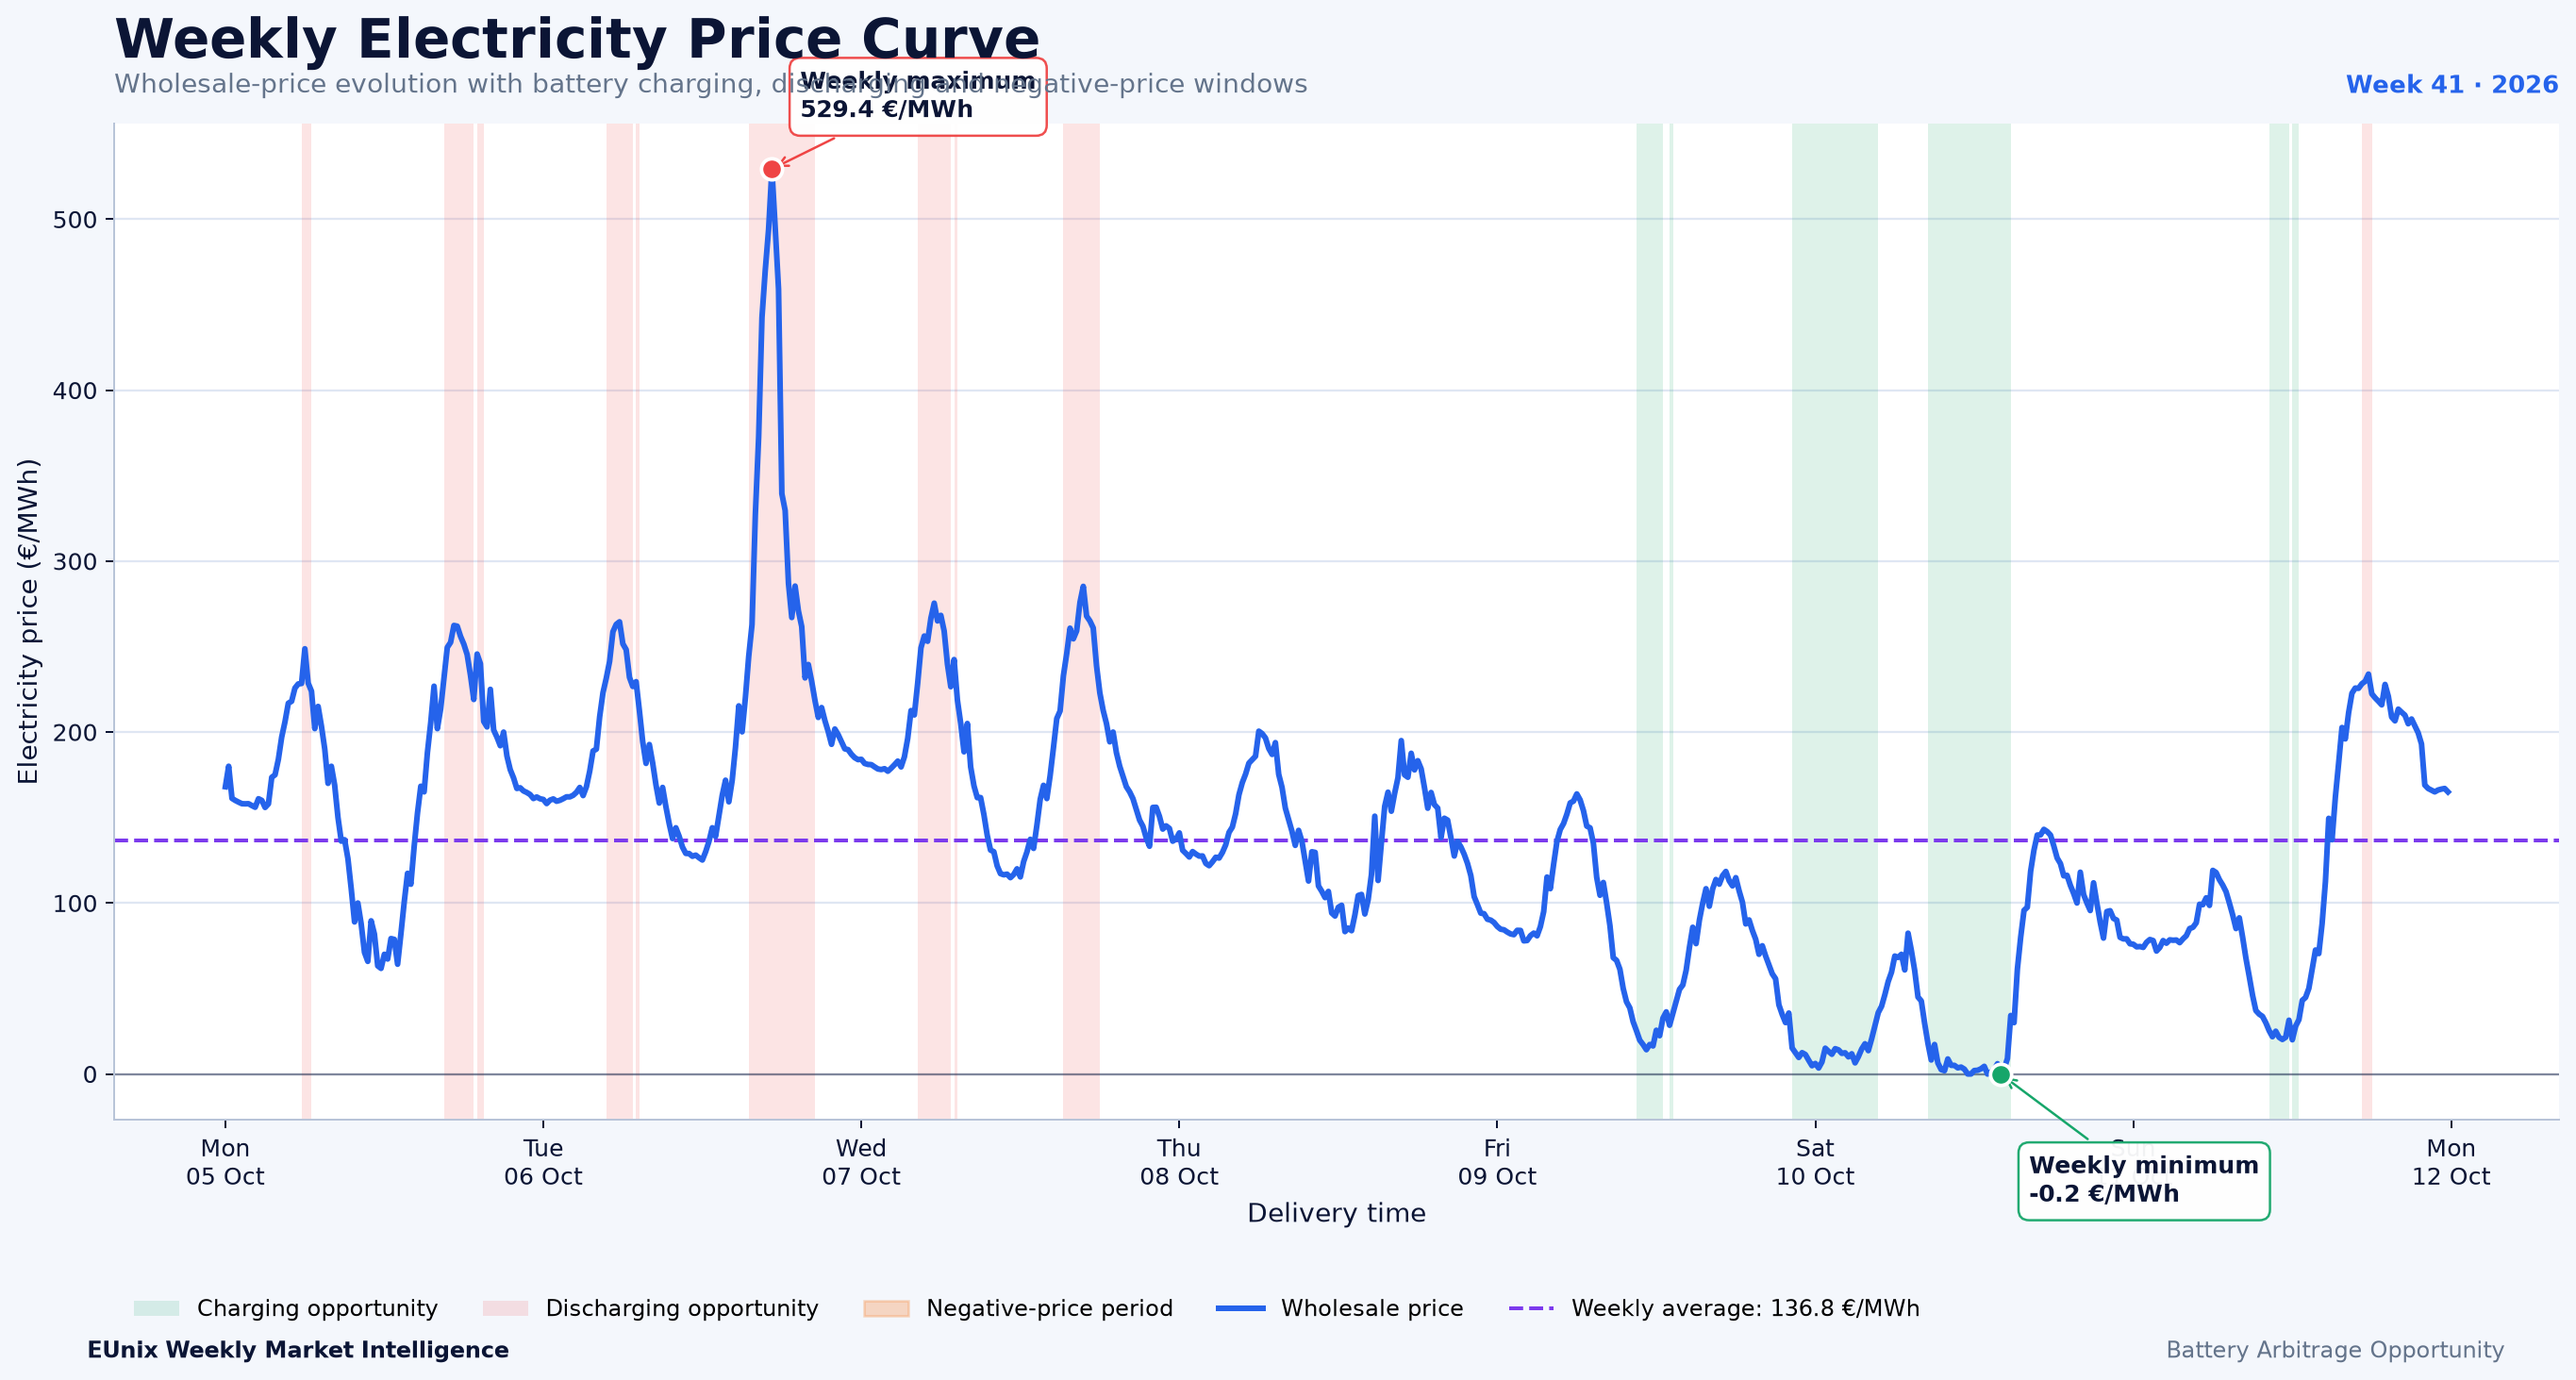
European electricity markets experienced significant price volatility in Week 41 (5–11 October 2026), with prices ranging from −€0.2/MWh to €529.4/MWh. The largest daily battery arbitrage spread reached €404.2/MWh, with 34 strong opportunity hours identified. EUnix Intelligence ranked battery arbitrage as the week's leading story, scoring 90.9/100 with 78.7% confidence. However, a simulated 1 MW / 1 MWh battery generated only €266 in gross weekly revenue, highlighting the gap between theoretical market opportunities and achievable storage returns.
Charts
Market Overview
Daily arbitrage spreads revealed the commercial significance of these movements. The largest daily spread occurred on Tuesday, 6 October, reaching €404.2/MWh, approximately twice the weekly average daily maximum spread of €201.2/MWh. Even the smallest daily maximum spread, recorded on Thursday at €117.3/MWh, remained substantial. The results indicate that meaningful intraday price differences were present throughout the reporting week, although their magnitude varied considerably.
The weekly price curve also revealed a transition in the timing of storage opportunities. During the earlier part of the week, pronounced price peaks created potential discharging opportunities, particularly around morning and evening periods. By Friday and Saturday, considerably lower prices created extended charging windows, while Sunday showed a recovery in prices during the evening. The battery opportunity timeline identified 34 hours of strong charging and discharging opportunities across these changing conditions.
The EUnix Intelligence Platform assigned the battery arbitrage story a priority score of 90.9/100, with severity and impact scores of 98.1 and 99.1, respectively. Supporting analytics reinforced the finding: battery opportunity scored 98.0, price volatility 88.1, and negative-price conditions 30.8. The story's high ranking was therefore primarily supported by large price spreads and identifiable storage operating windows rather than widespread negative electricity prices.
To evaluate the commercial implications, the platform simulated a 1 MW / 1 MWh battery with 95% charging efficiency, 95% discharging efficiency and approximately 90.2% round-trip efficiency. The illustrative dispatch generated €266.02 in gross weekly arbitrage revenue, equivalent to approximately 1.2 full-discharge cycles. However, the battery ended the week at 21.1% state of charge, compared with 50.0% initially, meaning the reported revenue was not adjusted for the reduction in stored energy.
Key Observations
Interpretation
The contrast between Tuesday's €404.2/MWh daily maximum spread and the simulated battery's relatively limited weekly activity is particularly revealing. A large daily price spread represents a theoretical charging-to-discharging opportunity, but it does not guarantee that a battery will capture the full difference. Realisable value depends on whether sufficient charging time precedes the high-price period, the available state of charge, energy capacity, conversion efficiency and the dispatch strategy.
The changing price structure across the week also highlights the importance of distinguishing between individual trading opportunities and the broader market pattern. Earlier periods were dominated by high-price discharging signals, while Friday and Saturday provided extended lower-price charging conditions. These operating windows suggest that batteries require a strategy capable of responding to changing price regimes rather than relying on a fixed daily charging and discharging schedule.
The simulation further illustrates the importance of operational constraints and revenue accounting. Although the battery generated €266 in gross arbitrage revenue, its final state of charge was substantially lower than its initial level. Some of the electricity sold therefore reflected energy available at the beginning of the simulation rather than energy purchased during the reporting week. Without restoring or valuing the terminal energy balance, the reported figure should not be interpreted as a fully normalised weekly trading profit.
Revenue Insight
Market Outlook
The transition from elevated prices earlier in the week to lower prices during Friday and Saturday is particularly relevant. If similar patterns recur, battery dispatch strategies may need to accommodate changing charging and discharging windows across different days rather than assume a consistent intraday price structure. Whether such patterns persist will require confirmation from subsequent reporting weeks.
Future analysis should also distinguish between the number of identified opportunity hours and the number of economically executable battery cycles. Week 41 identified 34 strong opportunity hours, yet the illustrative dispatch completed approximately 1.2 equivalent full-discharge cycles. Understanding this difference will help determine whether available opportunities are limited by storage capacity, energy availability, operating constraints or dispatch selection.
A further priority is evaluating battery revenues under consistent initial and terminal SOC conditions. The Week 41 simulation provides an initial measure of gross arbitrage performance, but comparisons across weeks or battery configurations will be more meaningful when changes in stored energy are explicitly accounted for alongside charging costs, degradation and other operating expenses.
Ultimately, Week 41 reinforces an important market-intelligence distinction: price volatility creates the opportunity, but battery dispatch determines the captured value. The next analytical step is to assess whether similarly large price spreads consistently translate into executable and economically attractive storage operation.
Simulation Note
Written by
Dr. G. O. C. Okwuibe
Quantitative Energy Systems Expert | Electricity Market & BESS
Dr. Godwin Okwuibe is a quantitative energy system expert specializing in electricity markets, battery storage optimization, and flexibility market design. His work focusses on translating complex market dynamics into actionable insights for industry stakehold...