
 Dr. G. O. C. Okwuibe
From €579.6/MWh Spikes to Negative Prices: Germany’s Market Whipsawed Through Week 27 — Week 27, 2026
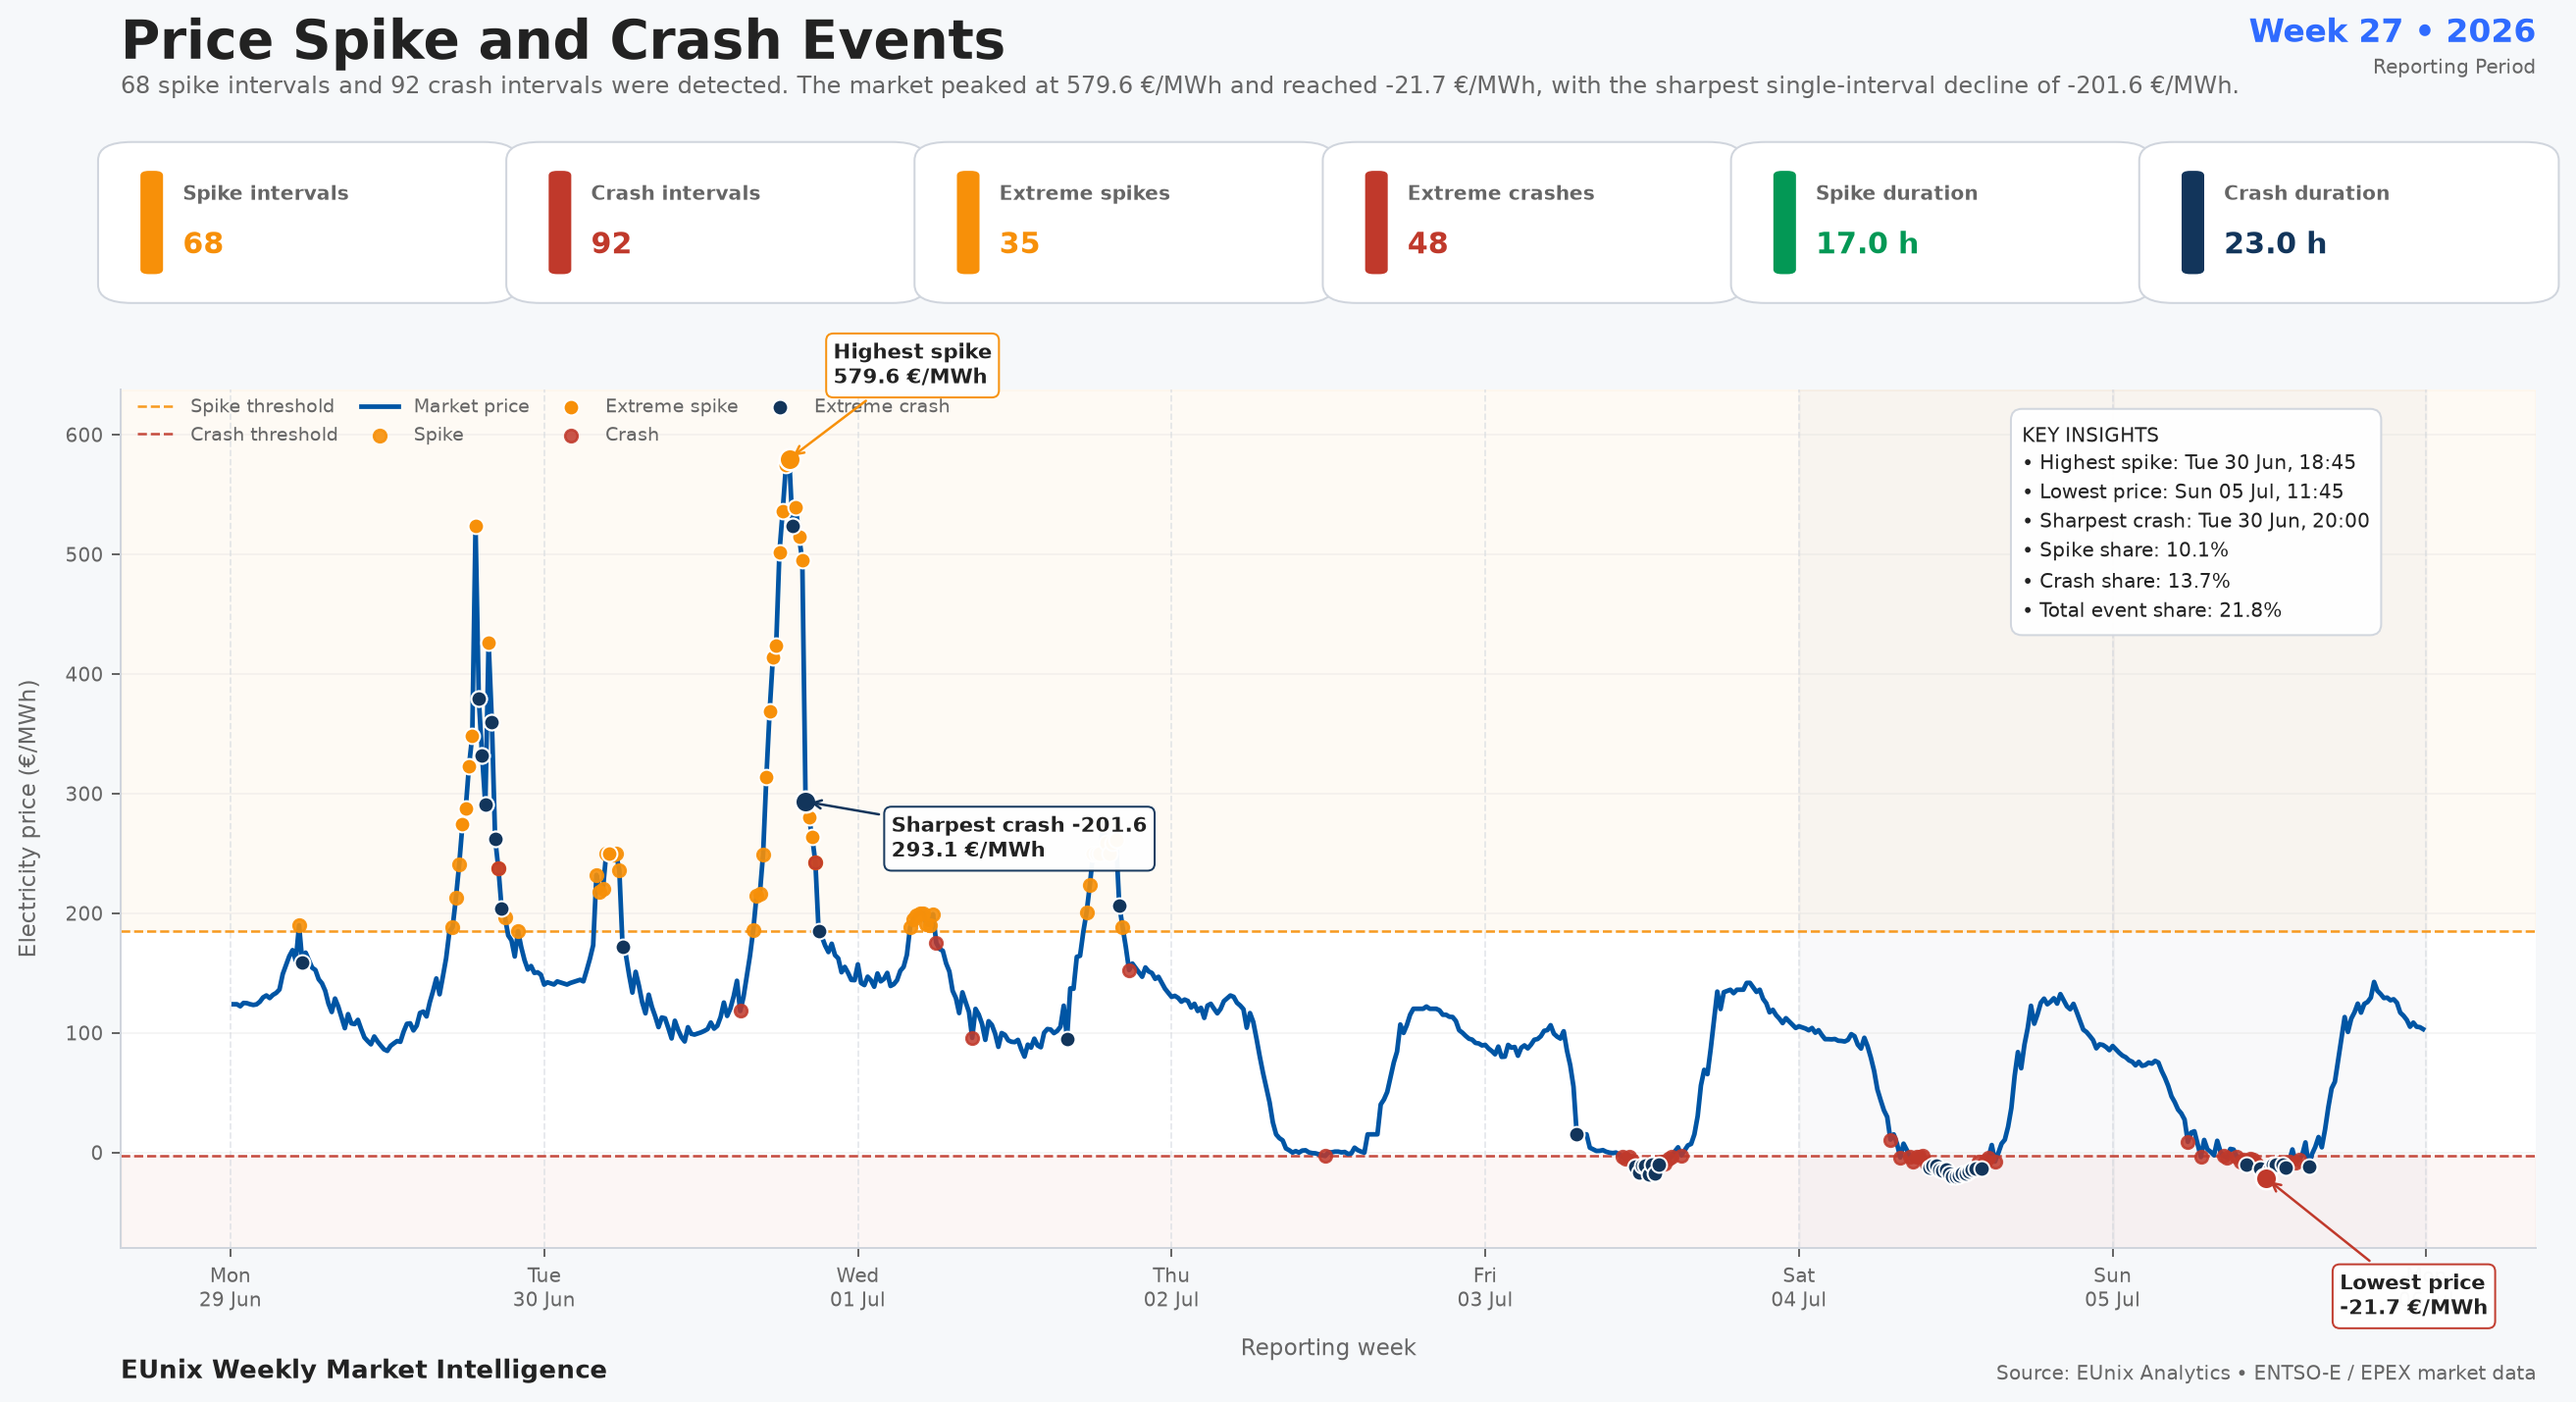
Germany’s power market shifted sharply between scarcity-like price spikes and negative-price conditions in Week 27. Prices ranged from -€21.7/MWh to €579.6/MWh, while 68 extreme interval movements were detected and the largest single-interval fall reached €201.6/MWh. The result was a week of elevated trading risk, concentrated particularly around Monday and Tuesday.
Charts
Market Overview
Wholesale prices averaged €106.1/MWh, but the weekly average masks a highly asymmetric distribution. Prices reached a maximum of €579.6/MWh and a minimum of -€21.7/MWh, creating a total weekly range of €601.3/MWh. Price standard deviation reached €89.1/MWh, while the distribution showed positive skewness of 1.73, reflecting the influence of the unusually high upper tail.
The most intense volatility occurred early in the reporting week. Tuesday, 30 June was identified as the most volatile day, with a €486.9/MWh daily spread and daily price standard deviation of €121.8/MWh. Monday ranked second in the daily volatility assessment, while volatility declined materially from Wednesday onward.
Interval-level behaviour was also abrupt. The average absolute interval price movement was only €8.8/MWh, yet the largest upward change reached +€175.2/MWh and the largest downward movement reached -€201.6/MWh. The analysis identified 68 extreme movements, showing that the week's risk came not only from the absolute price level but also from the speed at which prices changed.
Negative pricing added another dimension. The supplied analysis identifies 21.5 hours of negative prices, while the lower 5% price tail began below approximately -€9.8/MWh. At the opposite extreme, the upper 5% tail began at approximately €250.1/MWh, demonstrating unusually wide separation between the market's low- and high-price regimes.
Key Observations
Interpretation
The strongest instability was concentrated around Monday and Tuesday. The volatility heatmap shows the most intense hourly movements occurring particularly in the late afternoon and evening, while Tuesday dominates the daily volatility ranking. This concentration is important because weekly averages alone would substantially understate the operational and commercial exposure faced during these specific windows.
The asymmetry of the price distribution is also significant. With a skewness of 1.73, a 95th-percentile threshold of roughly €250.1/MWh, and a 99th percentile of approximately €505.3/MWh, the upside tail was particularly pronounced. Extreme prices were therefore relatively infrequent but economically large when they occurred.
At the same time, the market also spent 21.5 hours below zero. This combination of upper-tail scarcity pricing and negative-price periods means participants faced two-sided risk: expensive procurement during spikes and potential value erosion or disposal incentives during oversupplied intervals.
The 79/100 Severe trading-risk score therefore appears consistent with the wider evidence. Negative-price exposure and extreme tails each received maximum contribution scores on the supplied Trading-Risk Dashboard, while price volatility contributed 84/100.
Revenue Insight
Market Outlook
Tuesday's dominance is particularly notable. Its composite daily volatility score reached 100, compared with 78 for Monday and only 20 for Wednesday. If similar concentrated episodes recur, risk management should focus on identifying individual high-risk windows rather than relying primarily on weekly volatility averages.
Negative-price exposure should also remain under observation. The supplied data show that the latter part of the week repeatedly approached or moved below zero even after the early-week price spikes had disappeared. This suggests that upside price risk and oversupply-related downside risk can coexist within the same market environment.
The extreme-tail thresholds provide useful reference points for subsequent weeks: prices above roughly €250/MWh represented the upper 5% of the Week 27 distribution, while prices below approximately -€9.8/MWh represented the lower 5%. A recurrence of frequent observations beyond these levels would indicate that exceptional volatility remains embedded in the market.
For market participants, Week 27 reinforces the need to monitor not only price levels but also interval-to-interval movement, tail behaviour and the timing of volatility clusters.
Simulation Note
Written by
Dr. G. O. C. Okwuibe
Quantitative Energy Systems Expert | Electricity Market & BESS
Dr. Godwin Okwuibe is a quantitative energy system expert specializing in electricity markets, battery storage optimization, and flexibility market design. His work focusses on translating complex market dynamics into actionable insights for industry stakehold...