
 Dr. G. O. C. Okwuibe
Germany Exported More Power Overall — Yet Still Needed 15.8 GW of Imports at the Weekend — Week 29, 2026
Germany remained a strong net exporter in Week 29, yet its cross-border position changed sharply during specific hours. Imports supported the system during 43.9% of monitored intervals, peaked at 15.8 GW on Saturday, and accumulated 377 GWh across the week. The contrast between large weekly exports and concentrated import episodes highlights the growing operational value of cross-border flexibility.
Charts
Market Overview
That aggregate position, however, concealed repeated import-dependent periods. Imports were present during 43.9% of monitored intervals, equivalent to 73.75 hours, while the largest observed physical import requirement reached 15,817.9 MW.
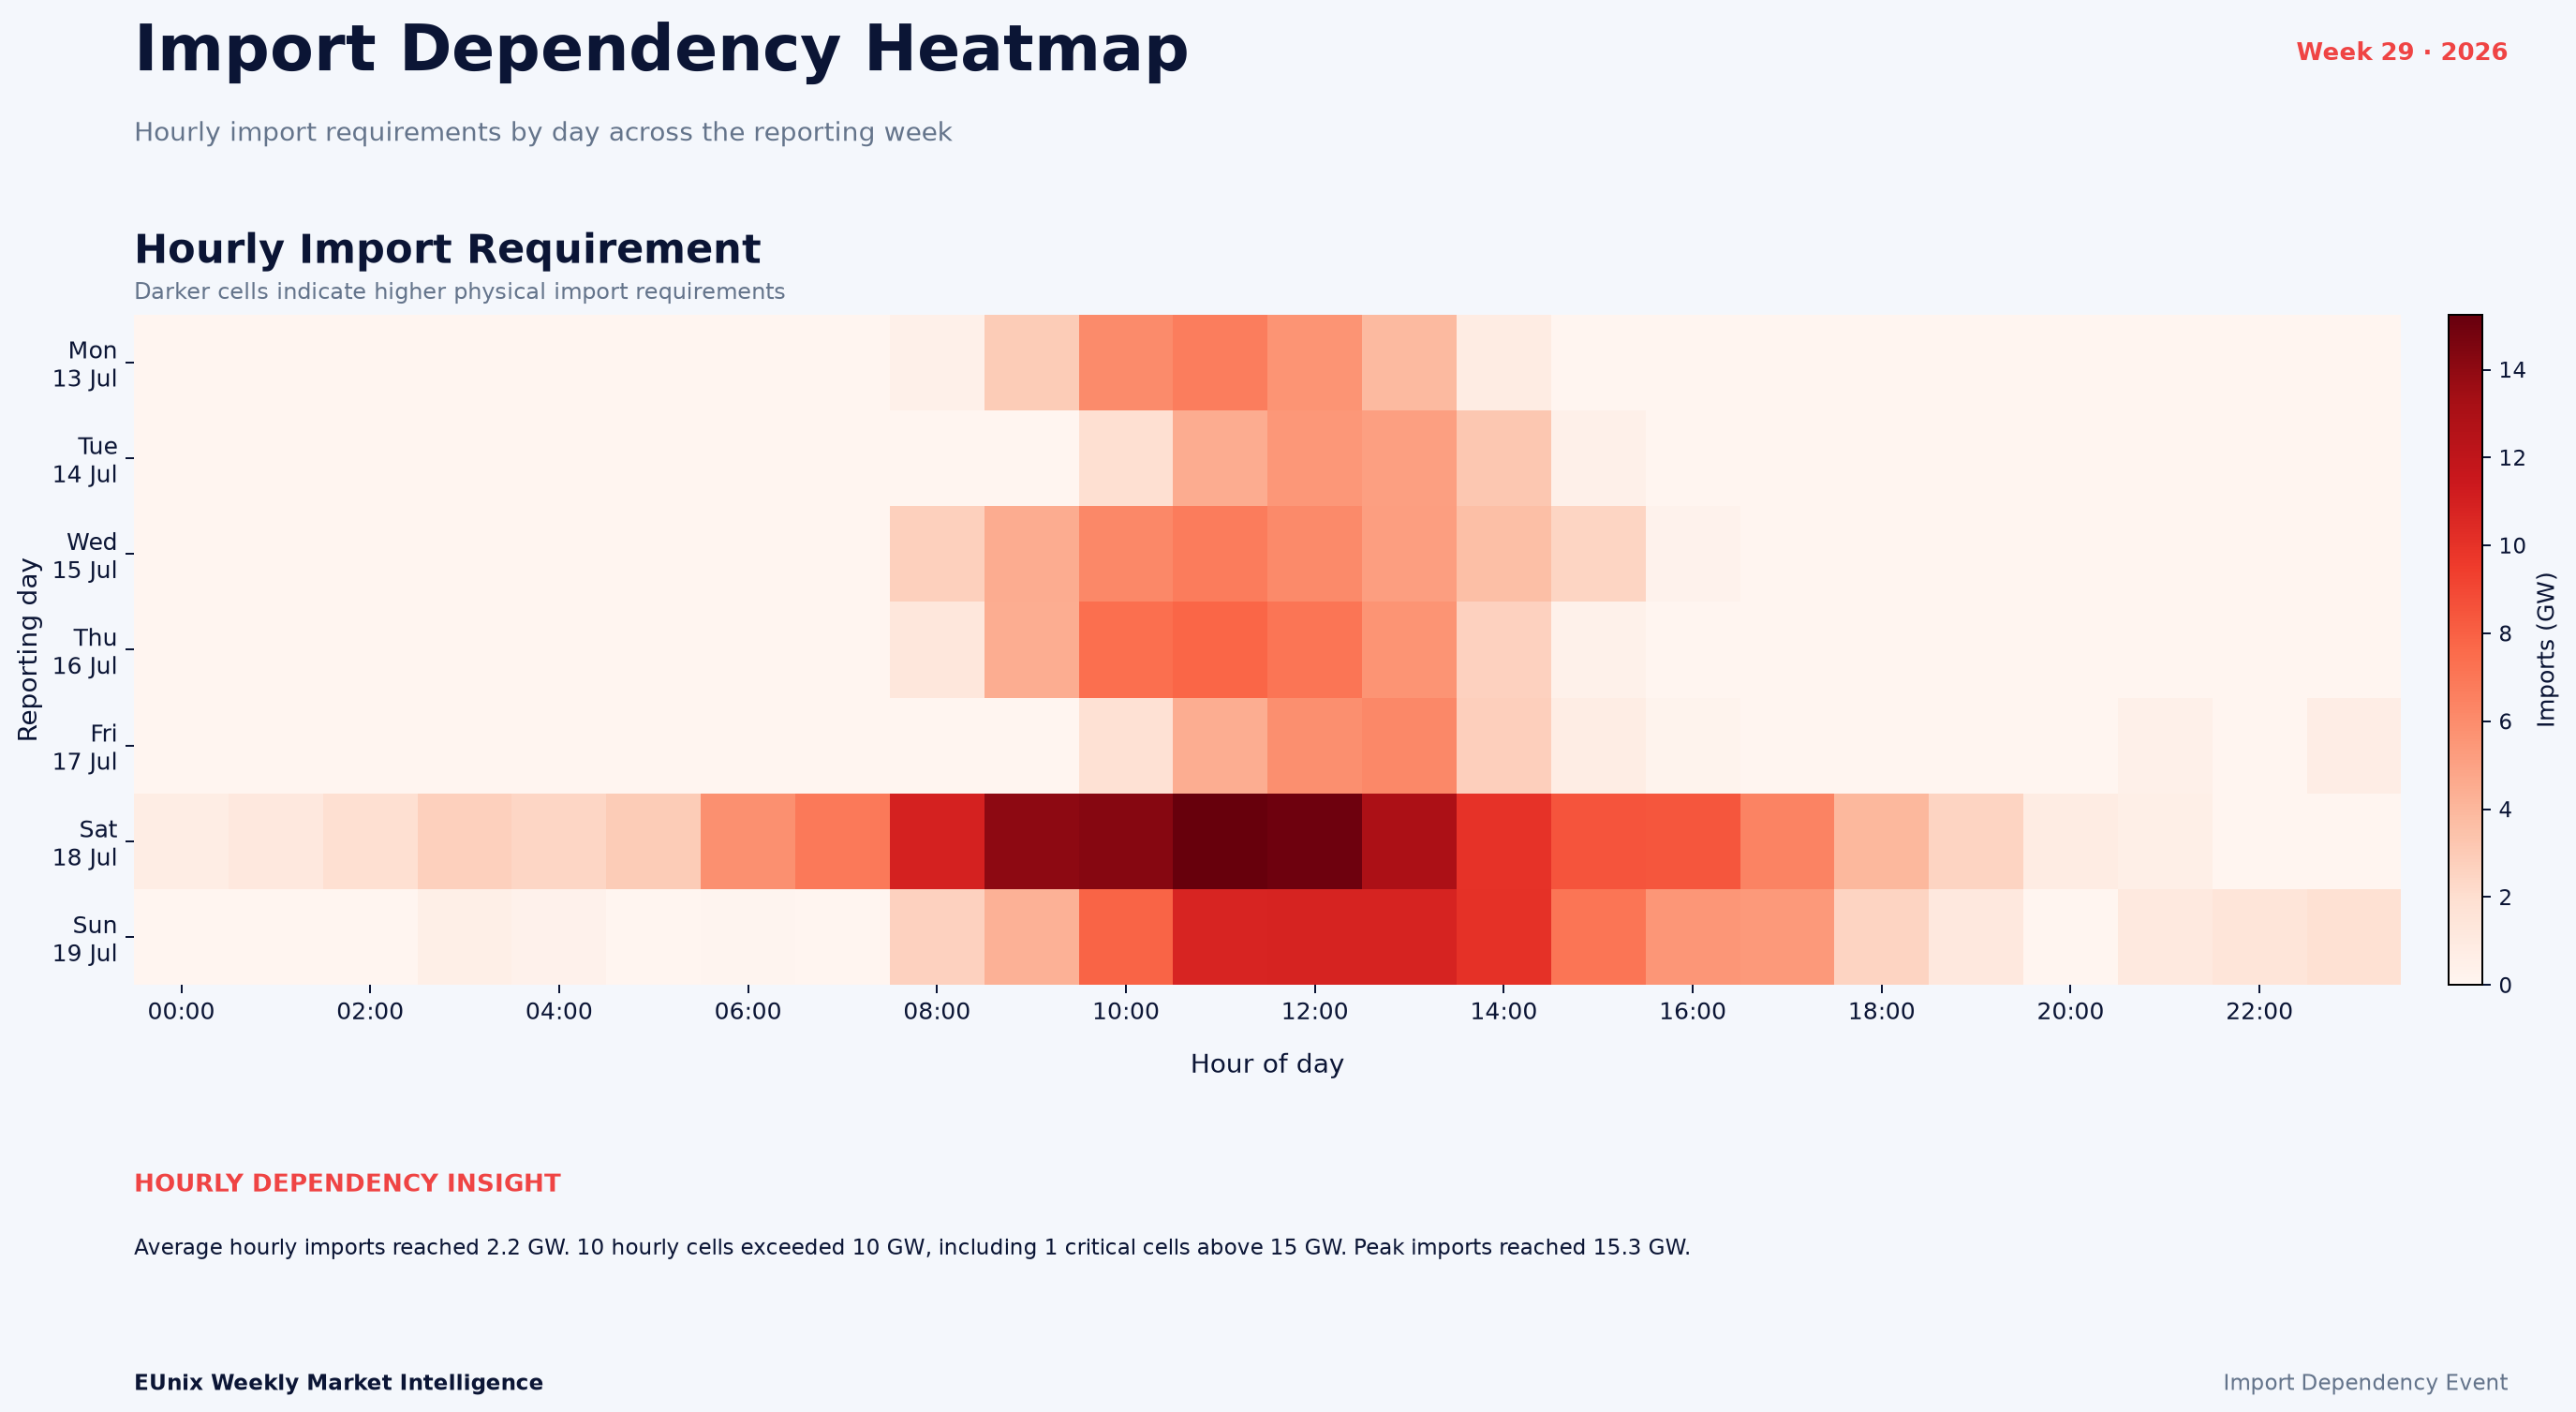
The most pronounced episode occurred on Saturday, 18 July, when import requirements accelerated sharply and peaked at approximately 15.8 GW at 11:30. The timeline also identifies a longest sustained import episode of roughly 22.2 hours, demonstrating that the weekend event was not simply an isolated quarter-hour spike.
The daily profile shows how exceptional Saturday was. Imported energy reached approximately 148 GWh that day, compared with only 21–38 GWh on most weekdays. Sunday remained comparatively import-intensive at approximately 85 GWh, while exports fell significantly relative to earlier in the week.
The EUnix Intelligence Platform ranked the story #1, with a priority score of 88.39, detection strength of 84.69% and confidence of 87.97%. Import dependency was the strongest supporting analytic at 98.48, followed by scheduled imports at 95.03 and net position at 60.57.
Key Observations
Interpretation
The concentration of the strongest import requirement on Saturday is particularly significant. Import volumes remained relatively modest during much of Monday–Friday before rising sharply over the weekend. This suggests that the cross-border system was being used dynamically rather than as a continuous source of supply.
The residual-load analysis adds another important dimension. Imports displayed a strong negative correlation of -0.84 with residual load. In the supplied data, imports tended to increase when residual load was comparatively low and disappear as residual load became high. The pattern therefore does not support a simple interpretation in which imports were driven primarily by rising domestic residual electricity demand.
Instead, the flows appear consistent with wider cross-border market conditions determining when external electricity became attractive or operationally useful. The recurring midday concentration visible in the heatmap also indicates that the timing of import dependence was systematic rather than random.
Supplier exposure remained reasonably distributed. Austria supplied 24.5%, Poland 18.4%, DK1 11.3%, the Czech Republic 11.2%, and the Netherlands 11.1%. The top three sources represented 54.2% of imported energy, while the HHI concentration index was 1,471. Cross-border reliance was therefore significant, but not dominated by a single supplier.
Revenue Insight
Market Outlook
The 15.8 GW peak provides a useful benchmark. Future weeks approaching or exceeding this level would indicate continued dependence on available neighbouring-market capacity during specific system conditions.
Austria’s role also deserves attention. Its 24.5% contribution made it the largest supplier, while Poland accounted for another 18.4%. A further increase in concentration around these borders could change the security profile even if overall import hours remain similar.
Finally, the persistent inverse relationship between residual load and imports should be tracked. If correlations near -0.84 continue, it would provide stronger evidence that Germany’s import episodes are being shaped by regional market optimisation and neighbouring-system conditions rather than domestic residual-load pressure alone.
Simulation Note
Written by
Dr. G. O. C. Okwuibe
Quantitative Energy Systems Expert | Electricity Market & BESS
Dr. Godwin Okwuibe is a quantitative energy system expert specializing in electricity markets, battery storage optimization, and flexibility market design. His work focusses on translating complex market dynamics into actionable insights for industry stakehold...