
 Dr. G. O. C. Okwuibe
Germany's 9.5 GW Forecast Surprise: When More Electricity Arrived Than Expected — Week 45, 2026
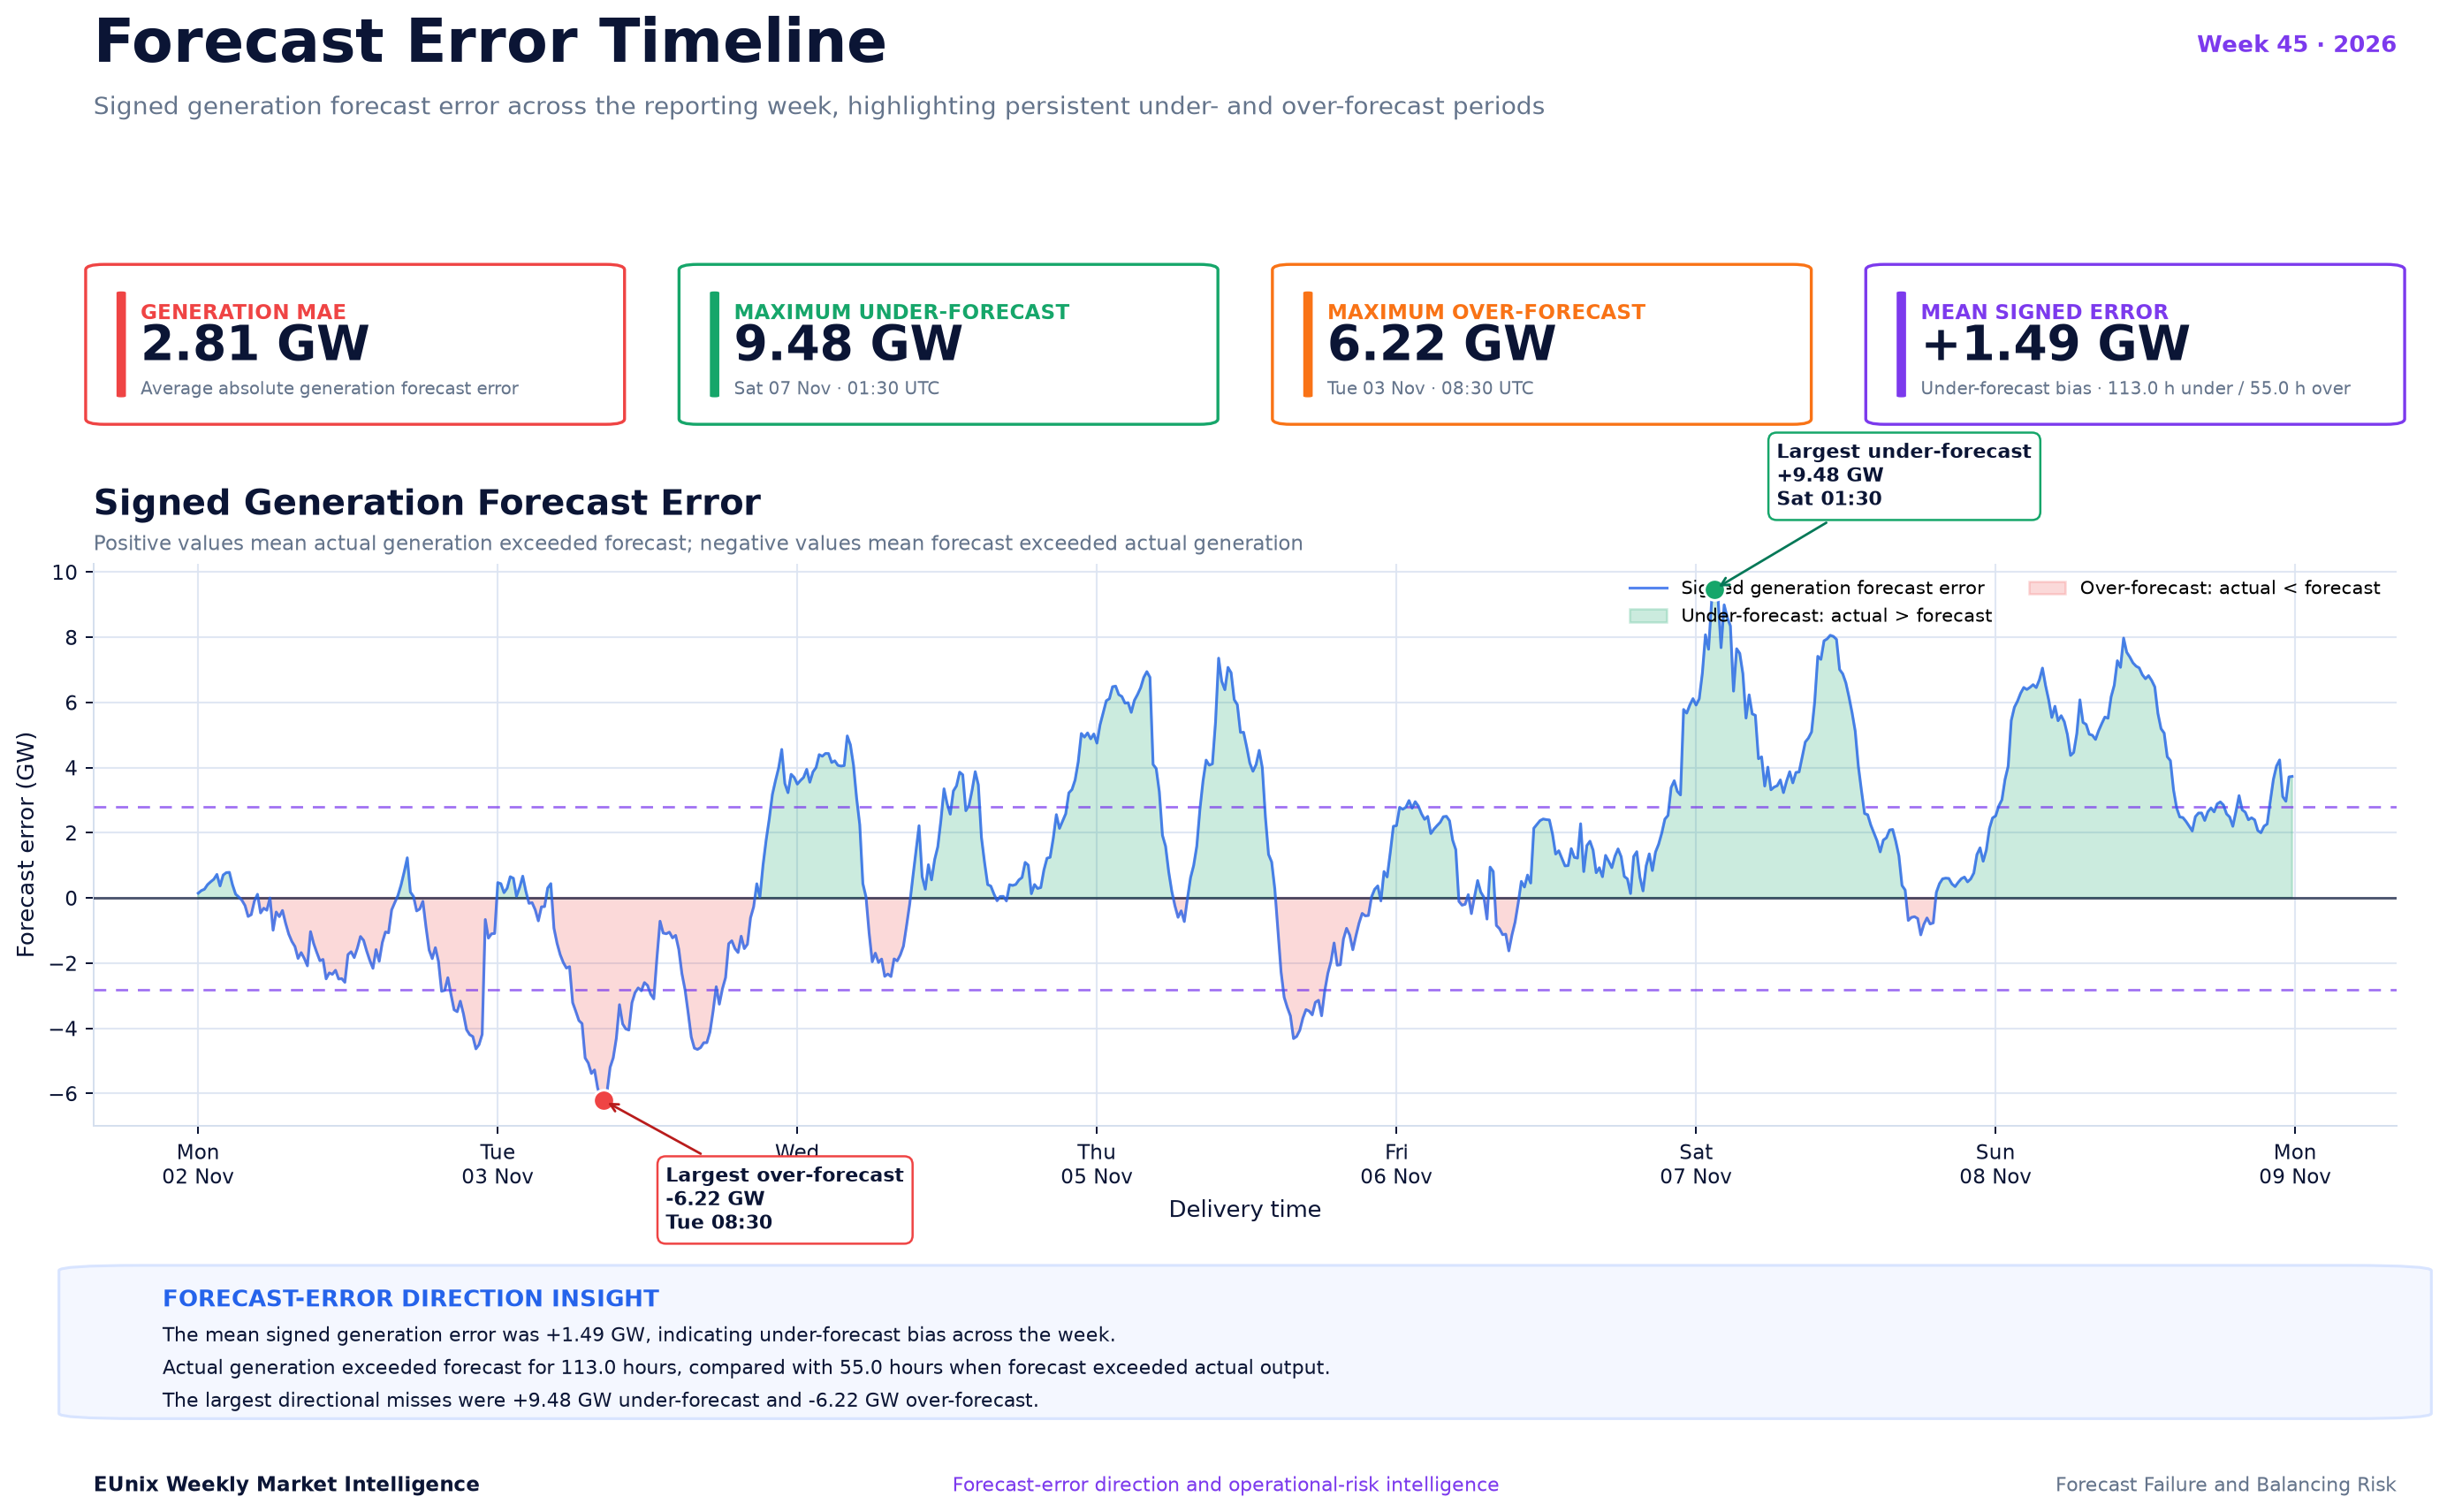
Germany's electricity generation forecasts struggled to keep pace with actual output during Week 45 (2–8 November 2026). The EUnix Intelligence Platform recorded an average absolute forecast error of 2.81 GW, with the largest miss reaching 9.48 GW. Actual generation exceeded forecasts for 113 hours, compared with 55 hours of over-forecasting. Meanwhile, schedule deviations reached 22.26 GW, but their weak correlation with forecast errors suggests a more complex relationship between generation uncertainty and balancing exposure.
Charts
Market Overview
Forecast performance varied considerably throughout the reporting period. Monday, 2 November, recorded the lowest daily MAE of 1.42 GW, while Sunday, 8 November, experienced the highest at 4.53 GW. Saturday also showed elevated forecast uncertainty, with a daily MAE of 3.87 GW. These results indicate that forecast accuracy deteriorated toward the weekend, particularly as actual generation increasingly exceeded anticipated output.
The directional pattern was equally notable. Actual generation remained above forecast levels for approximately **113 hours**, representing 67.3% of the reporting period, while forecasts exceeded actual generation for the remaining 55 hours. The largest under-forecast reached +9.48 GW, compared with a maximum over-forecast of −6.22 GW on Tuesday, 3 November, at 08:30 UTC. The ten largest individual forecasting misses were all under-forecast events, averaging 8.59 GW, with nine occurring on Saturday and one on Sunday.
Alongside the forecasting errors, the system recorded a maximum physical-versus-scheduled deviation of **22.26 GW** and a maximum reported border-balancing gap of **2.07 GW**. The average absolute border-balancing gap was approximately 0.59 GW. However, the relationship between forecast errors and schedule deviations remained weak: the signed correlation was −0.16, while the correlation between their absolute magnitudes was −0.12. These figures suggest that larger generation forecasting errors did not consistently coincide with larger schedule deviations.
The EUnix Intelligence Platform ranked Forecast Failure and Balancing Risk as its second-highest-priority intelligence story for the reporting week, assigning a priority score of 80.3 and confidence of 71.7%. The combined operational-risk indicators showed their strongest relative concentration on Thursday, 5 November, while forecast-error exposure reached its highest daily level on Sunday. This distinction highlights how different operational-risk components can peak at different times.
Key Observations
Interpretation
The transition from negative forecast bias early in the week to increasingly positive errors later is particularly important. Monday and Tuesday were characterised by over-forecasting, while Wednesday through Sunday showed under-forecasting. By Sunday, the mean signed error had reached +4.53 GW. This pattern suggests that the forecasting errors were not distributed symmetrically across the week. Instead, the data indicate a sustained change in forecasting performance that would warrant closer examination of the underlying generation technologies, weather inputs and forecast updates.
The concentration of extreme errors during the weekend reinforces this interpretation. Nine of the ten largest forecasting misses occurred on Saturday, with the remaining event occurring on Sunday. These errors were all positive, meaning actual generation exceeded expectations. Such clustering is consistent with a sustained forecasting bias rather than isolated random errors. However, the supplied charts do not identify the technologies responsible, so the deviations cannot be attributed specifically to wind, solar, conventional generation or any particular weather event.
An equally important finding concerns the relationship between generation forecast errors and physical-versus-scheduled electricity positions. Although the system experienced a maximum schedule deviation of 22.26 GW, the magnitude correlation of −0.12 indicates that large forecasting errors were not systematically associated with large schedule deviations. Indeed, the largest 9.48 GW forecast miss coincided with a schedule deviation of approximately 2.70 GW. This weak relationship suggests that generation forecasting uncertainty alone cannot explain the observed schedule deviations.
The balancing-risk dashboard provides a broader operational perspective. Thursday recorded the highest combined relative exposure, despite Sunday having the weakest generation forecast accuracy. This indicates that operational-risk conditions depend on several interacting indicators rather than forecast accuracy alone. The results therefore support a more integrated approach to electricity-market intelligence, combining forecasting performance, schedule deviations and balancing-related indicators while maintaining clear distinctions between them.
Revenue Insight
Market Outlook
A priority for subsequent monitoring should be to determine whether the positive forecast bias observed during Week 45 continues, reverses or disappears. The available data cover only the reporting week and do not establish a forecast for future electricity generation or market conditions. Nevertheless, the observed pattern provides a useful reference for evaluating subsequent forecasting performance.
The intraday distribution also deserves attention. The highest average absolute forecast error occurred at 11:00 UTC, while the strongest systematic positive bias occurred at 01:00 UTC. Monitoring these recurring hourly patterns could help identify periods when forecast recalibration or more frequent updates may be valuable. Whether these patterns persist across additional weeks remains to be established.
For traders, aggregators and flexibility operators, the key operational implication is the need to distinguish forecasting uncertainty from actual balancing requirements. The weak observed correlations indicate that generation forecast errors and schedule deviations should not be treated as interchangeable measures. Combining these indicators with market prices and balancing activation data would provide a stronger foundation for assessing commercial exposure and flexibility opportunities.
**The central lesson from Week 45 is that forecast accuracy is not only about how large an error becomes, but also how long it persists, which direction it takes and whether it translates into measurable market exposure.** The week's 9.48 GW forecasting miss was significant, but the sustained under-forecasting bias and weak relationship with schedule deviations provide the deeper intelligence for electricity-market participants.
Simulation Note
Written by
Dr. G. O. C. Okwuibe
Quantitative Energy Systems Expert | Electricity Market & BESS
Dr. Godwin Okwuibe is a quantitative energy system expert specializing in electricity markets, battery storage optimization, and flexibility market design. His work focusses on translating complex market dynamics into actionable insights for industry stakehold...