
 Dr. G. O. C. Okwuibe
Germany’s Import Reliance Intensified as Sunday Demand for Cross-Border Power Hit 16.5 GW — Week 28, 2026
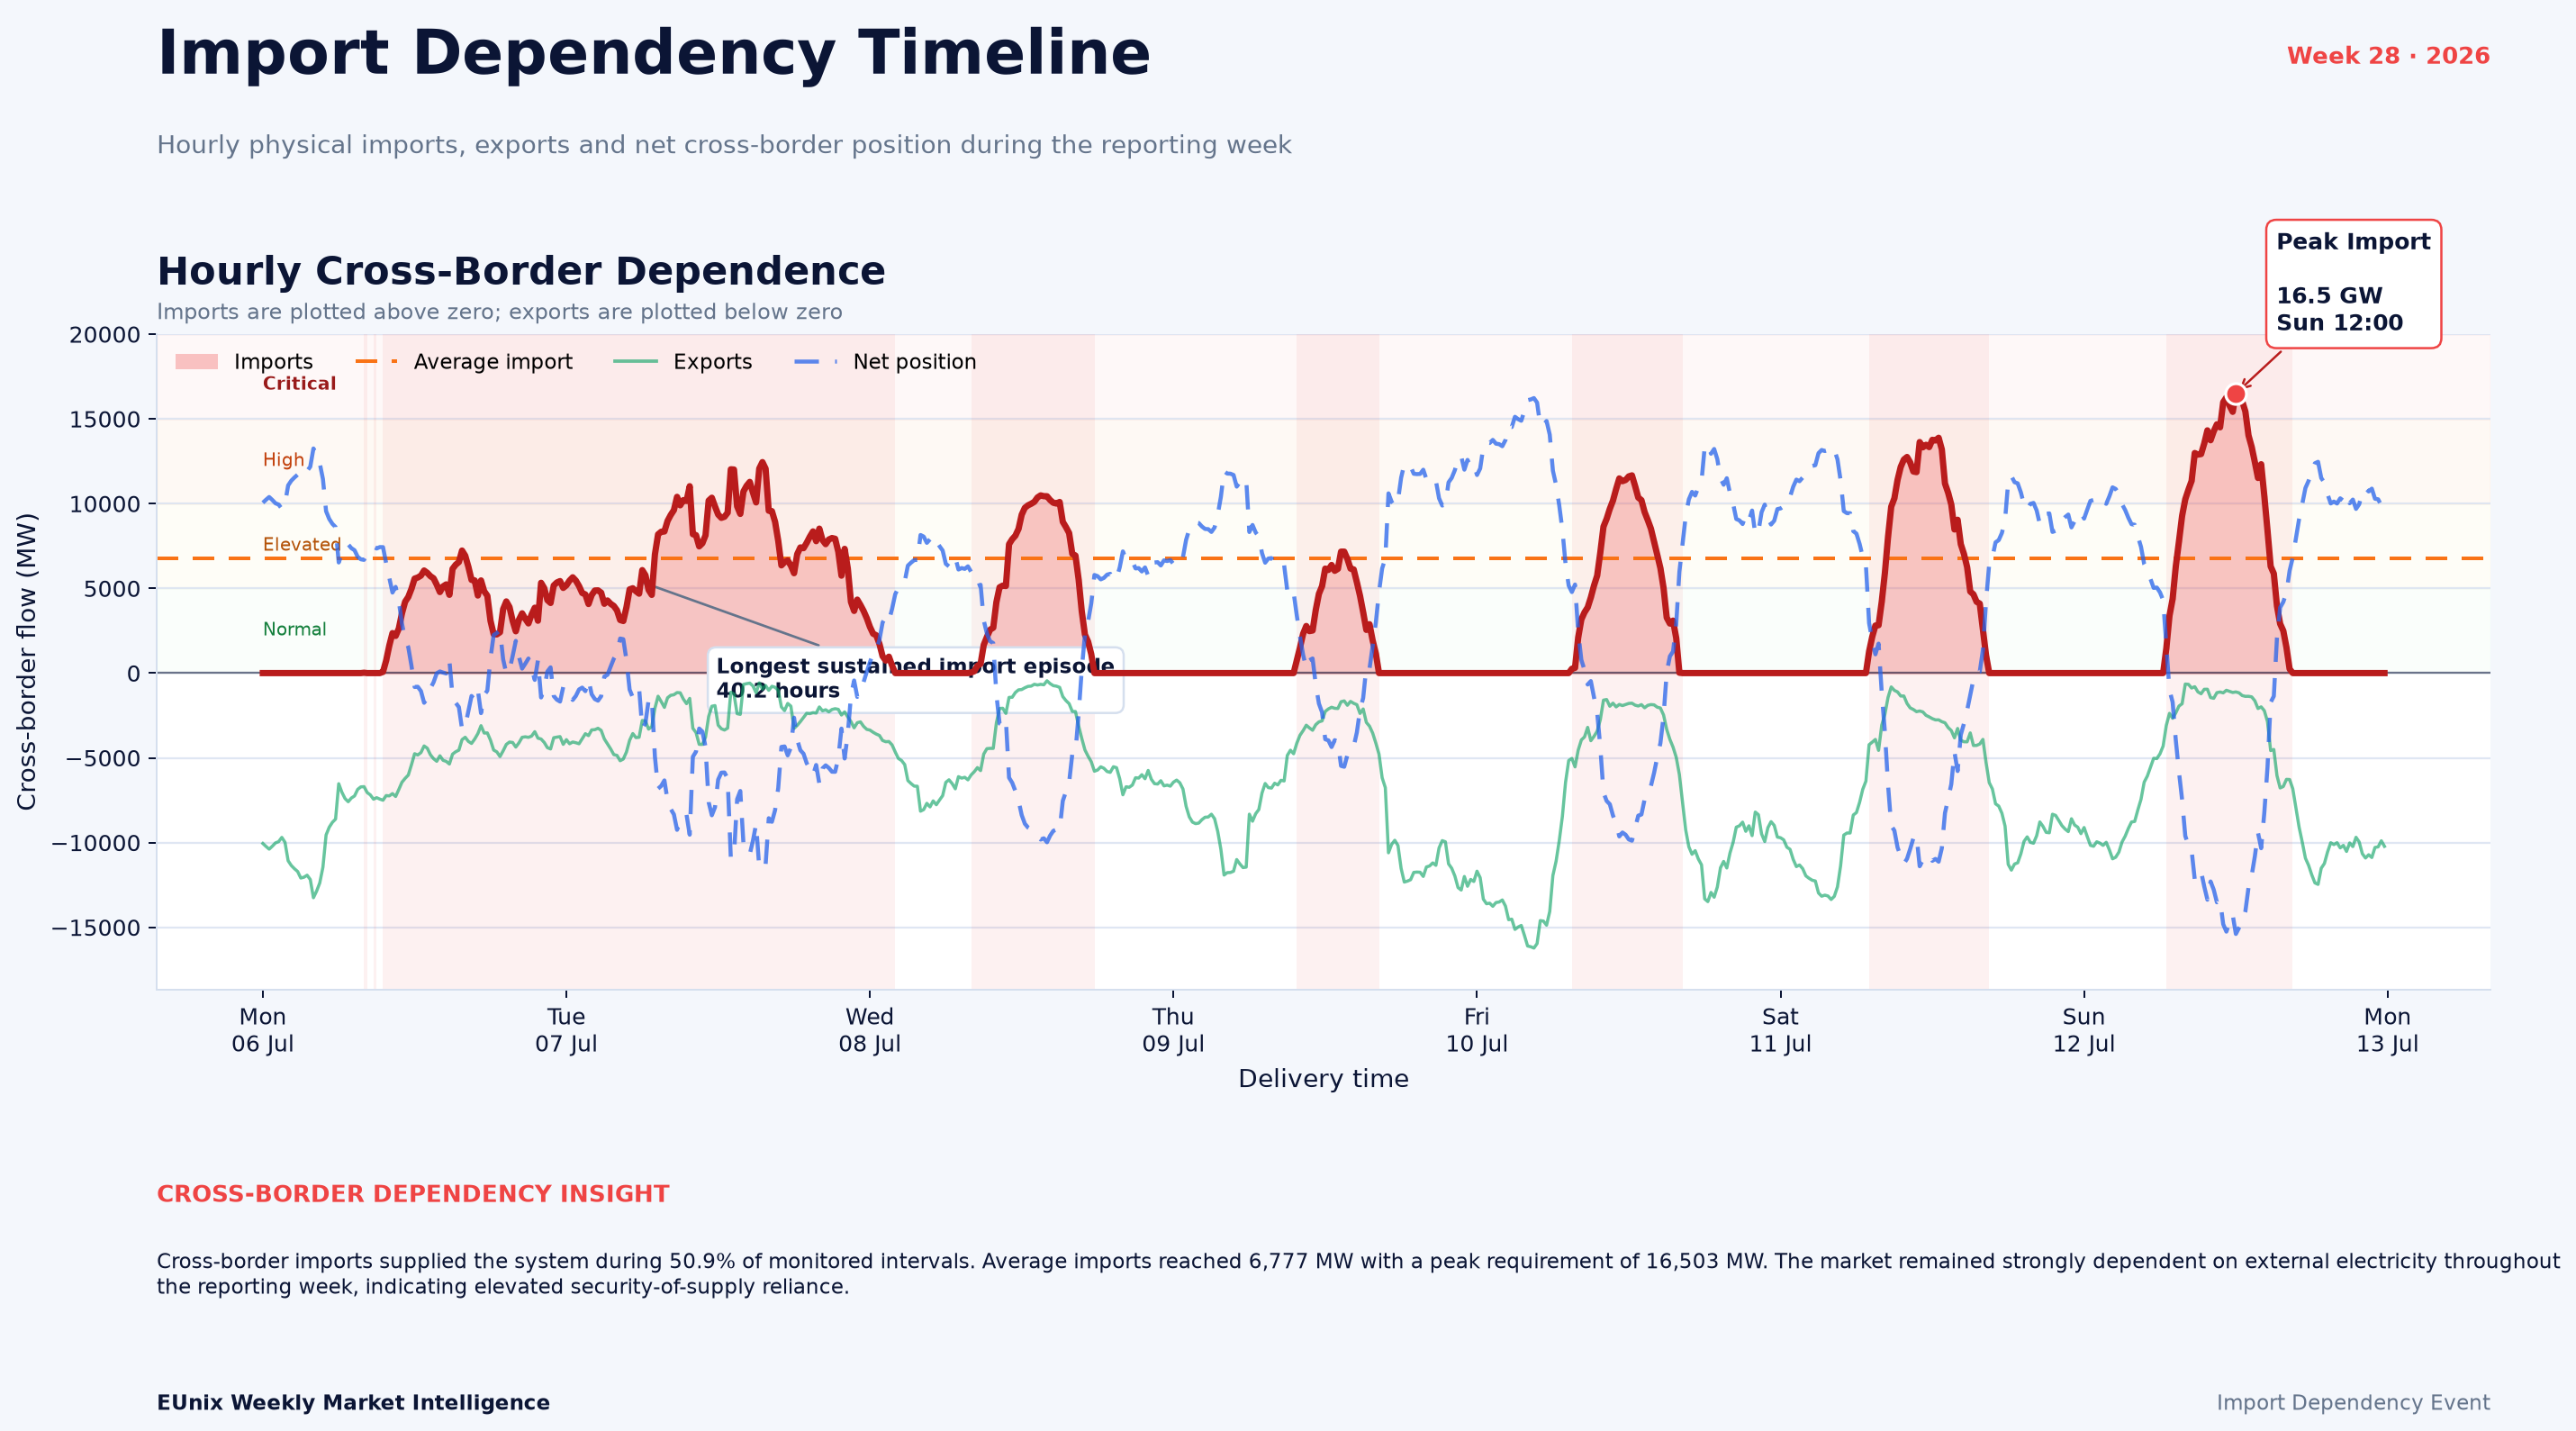
Germany’s cross-border position became increasingly import-dependent in Week 28, with imports supporting the system during 50.9% of monitored intervals and peaking at 16.5 GW on Sunday. Import exposure lasted 85.5 hours, while the EUnix Intelligence Platform assigned the event a 90.11 priority score and 88.79% confidence, pointing to a material security-of-supply and cross-border flexibility story.
Charts
Market Overview
Across the reporting week, estimated gross imported energy reached 579 GWh. At the same time, gross exports were substantially larger at 1,047 GWh, leaving weekly net imported energy at -468 GWh. This is an important distinction: Germany was a net exporter across the full week even though it experienced significant periods when imports became operationally important.
The daily profile reinforces this contrast. Tuesday recorded approximately 175 GWh of imports, while Sunday recorded about 106 GWh. Yet exports exceeded imports on most days, particularly Thursday and Friday, demonstrating how rapidly Germany’s cross-border position moved between importing and exporting conditions.
Import intensity became particularly concentrated later in the week. The hourly heatmap shows strong import requirements around midday on Friday, Saturday and especially Sunday. 21 hourly cells exceeded 10 GW, including two critical cells above 15 GW.
The story was ranked #1 with a priority score of 90.11. Import dependency itself received an investigation-priority score of 100, scheduled imports 95.94, and net position 60.03, supporting the conclusion that the week’s cross-border behaviour was operationally significant.
Key Observations
Interpretation
The timing of those windows is especially important. Import dependence became strongest around daytime periods toward the end of the week, with Sunday producing the most severe requirement. This means cross-border capacity functioned less as a constant energy source and more as a high-value balancing and system-support mechanism during selected hours.
The relationship with residual load adds another interesting dimension. The supplied analysis reports a strong -0.87 correlation between imports and residual load. Imports tended to fall as residual load increased rather than rising with domestic residual demand. That suggests the import episodes cannot be interpreted simply as Germany importing because domestic demand exceeded renewable production.
Instead, the observed flows appear to reflect broader European market conditions, cross-border price relationships and available neighbouring generation. That interpretation is also consistent with Germany alternating between substantial exports and very large import episodes within the same week.
Supplier concentration was relatively diversified. Austria was the largest individual contributor at 21.1%, while the top three borders represented 50.7% of imported energy and the concentration index stood at 1,320. The system therefore relied heavily on cross-border availability without depending overwhelmingly on one single neighbouring market.
Revenue Insight
Market Outlook
Sunday’s 16.5 GW peak should therefore serve as a useful benchmark. Similar or higher requirements in subsequent weeks would indicate that high-volume cross-border support remains embedded in the market rather than representing an isolated event.
The supplier mix should also be monitored. Austria contributed 21.1%, followed by the Netherlands at 15.4%, Poland at 14.1%, DK1 at 13.4%, and the Czech Republic at 11.1%. Diversification currently limits single-border concentration, but a material shift toward one source would change the associated supply-risk profile.
Finally, the strong negative relationship between imports and residual load deserves continued attention. If this pattern persists, it would strengthen the case that import behaviour is being driven primarily by broader regional market economics and cross-border optimisation rather than domestic residual-demand pressure alone.
Simulation Note
Written by
Dr. G. O. C. Okwuibe
Quantitative Energy Systems Expert | Electricity Market & BESS
Dr. Godwin Okwuibe is a quantitative energy system expert specializing in electricity markets, battery storage optimization, and flexibility market design. His work focusses on translating complex market dynamics into actionable insights for industry stakehold...