
 Dr. G. O. C. Okwuibe
Germany’s Scheduled and Physical Cross-Border Flows Diverged by as Much as 24.2 GW - Week 9, 2026
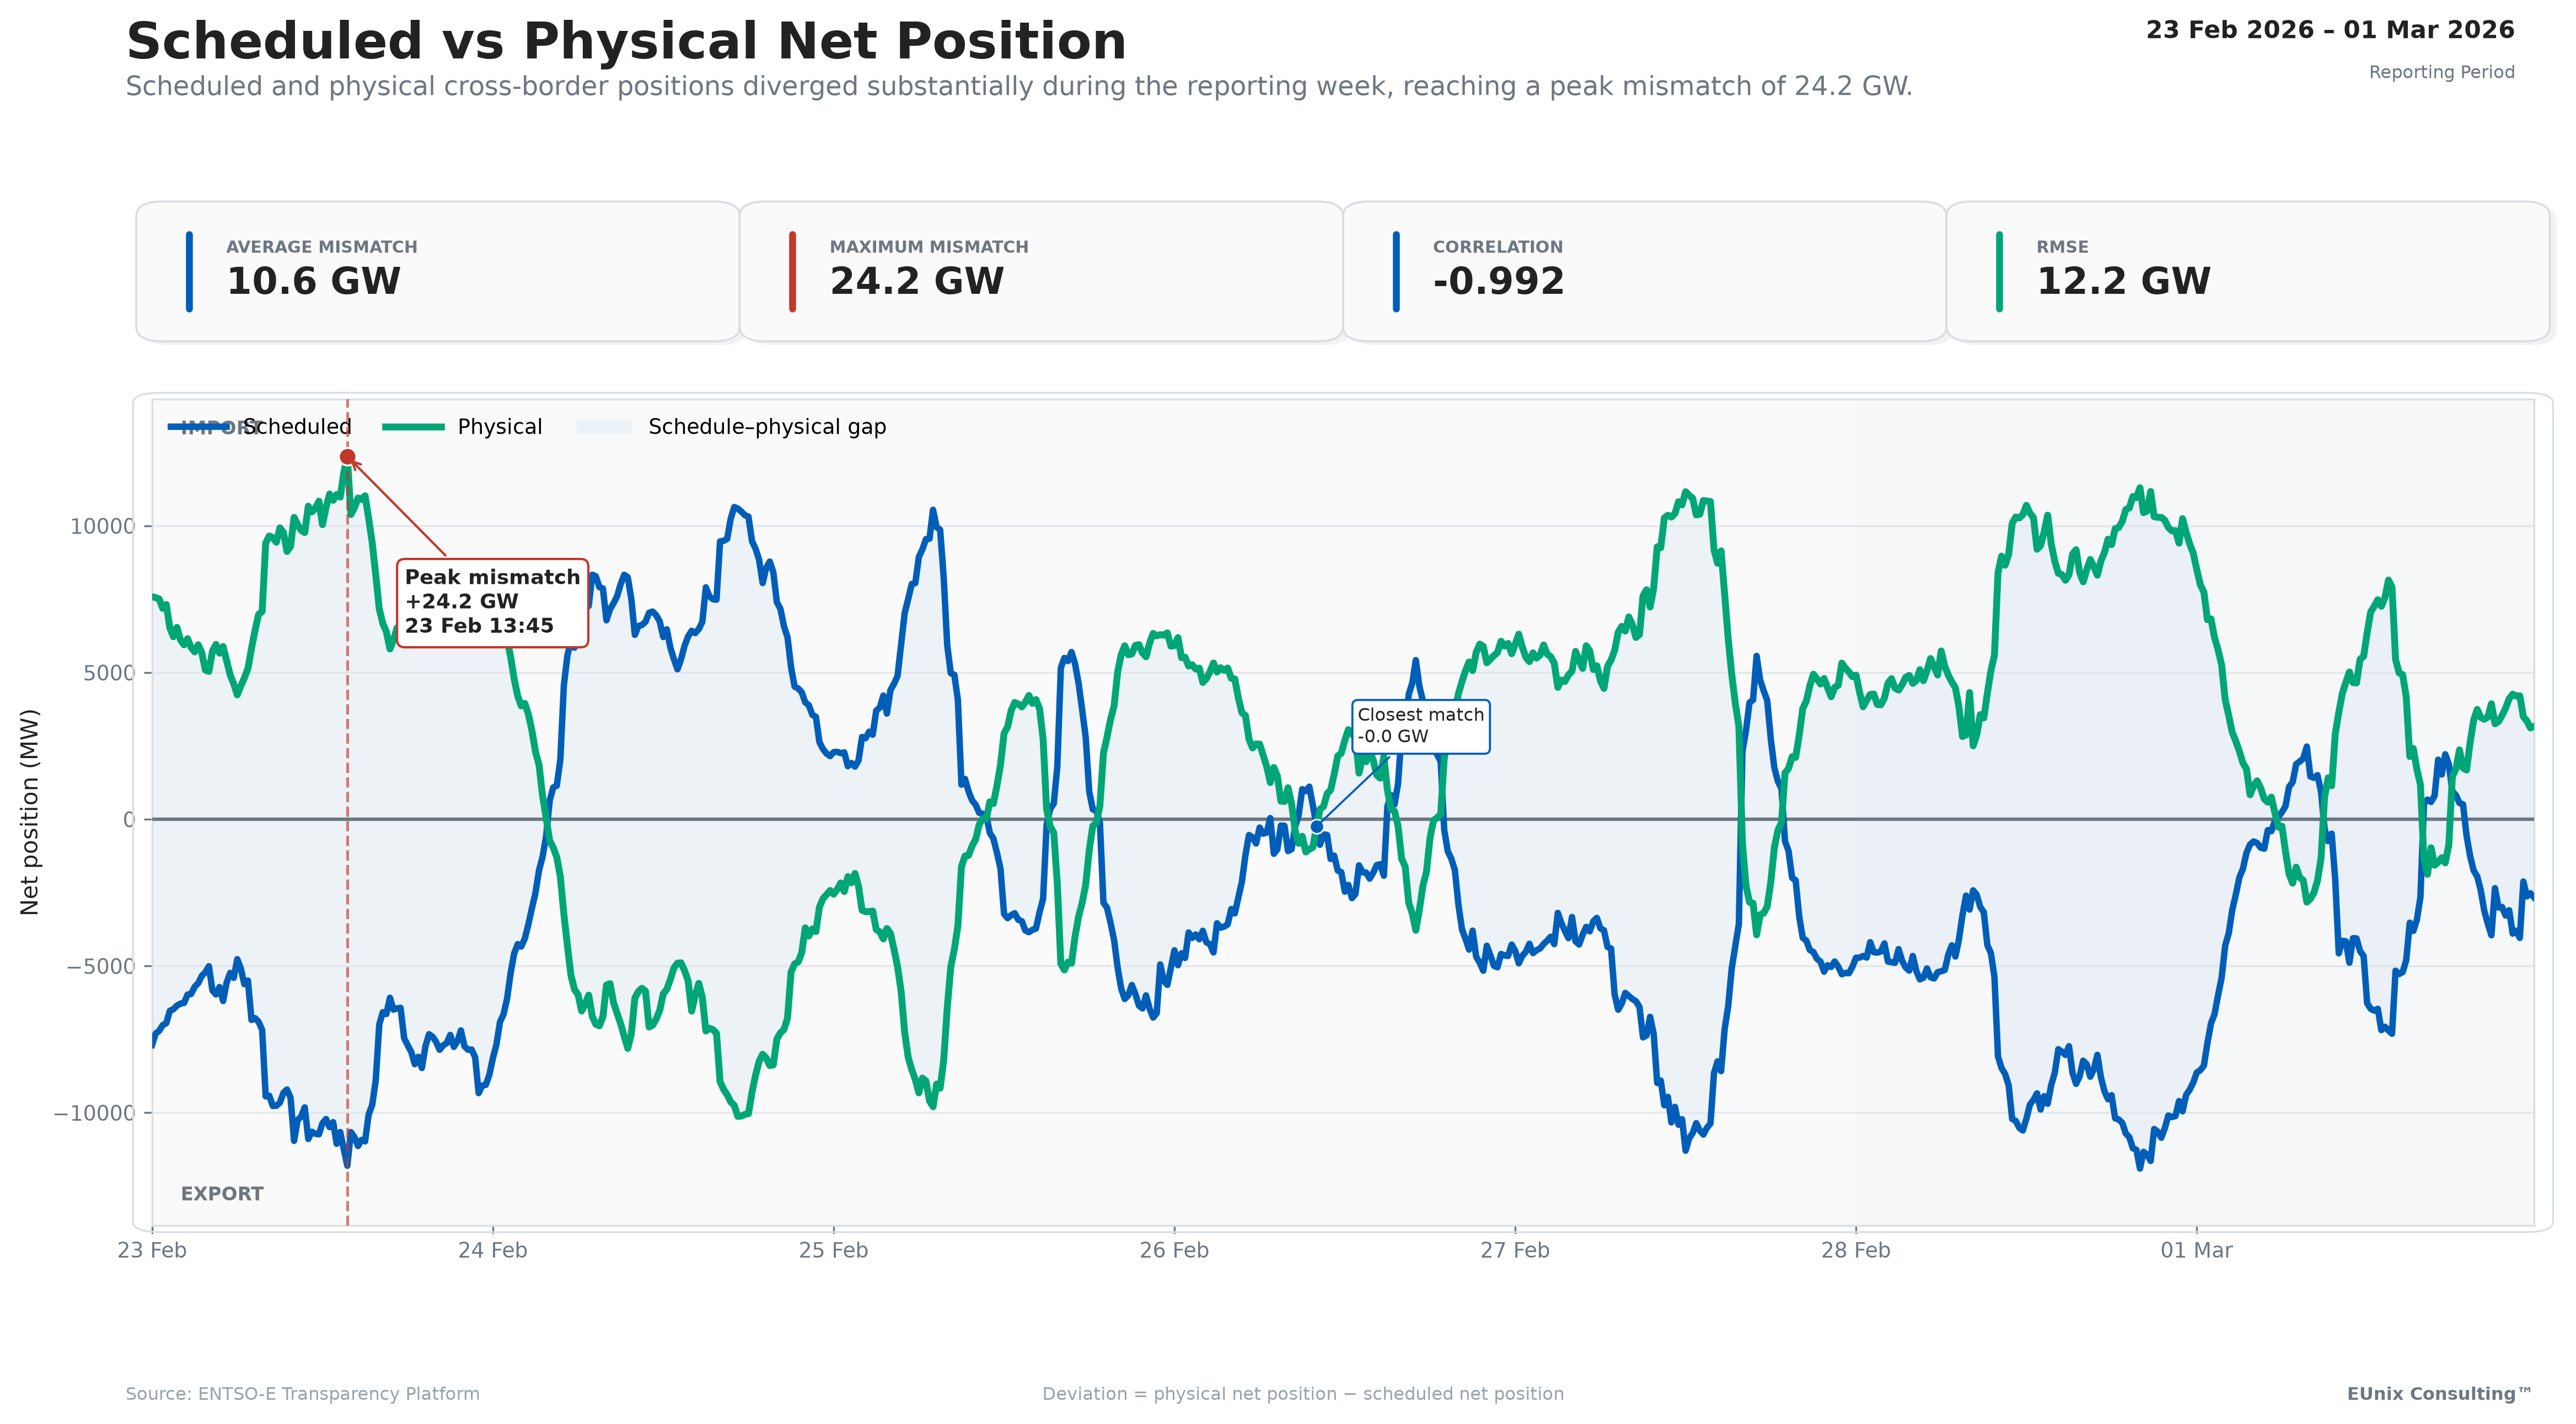
Germany experienced persistent divergence between scheduled and physical cross-border electricity positions in Week 9. The average absolute mismatch reached about 10.6 GW, while the largest deviation climbed to 24.2 GW. Seven persistent mismatch events were identified, contributing 577.7 GWh of absolute mismatch energy and signalling elevated operational complexity across the interconnected system.
Charts
Market Overview
The central feature of the week was the unusually large and persistent separation between Germany's scheduled cross-border market position and observed physical flows.
Across the reporting period, the average absolute deviation was approximately 10.6 GW, while the maximum mismatch reached 24.17 GW at 13:45 UTC on Monday, 23 February. The RMSE between scheduled and physical positions was approximately 12.18 GW.
Most strikingly, 671 of 672 monitored intervals — 99.9% — exceeded the 100 MW deviation threshold used in the analysis. Operational alignment under that threshold was therefore effectively 0%.
The scheduled and physical positions also exhibited a correlation of approximately −0.992. This should not be interpreted by itself as proof of market failure; rather, within the position conventions used in this analysis, it highlights how differently the two series evolved during the week and reinforces the need to examine the underlying cross-border flows.
Key Observations
Interpretation
Scheduled exchanges describe market positions agreed across borders. Physical flows, however, emerge from the electrical state of the interconnected European transmission network and are influenced by network topology, generation and load distribution, congestion management, loop and transit flows, and other system conditions.
Consequently, a schedule–physical mismatch should not automatically be interpreted as an imbalance or failure to deliver a commercial transaction.
What makes Week 9 noteworthy is the scale and persistence of the divergence. With almost every monitored interval exceeding the analytical threshold and several multi-hour events exceeding 20 GW, the system repeatedly operated with physical cross-border positions materially different from scheduled net positions.
The relatively weak relationship between schedule deviation and the border-balancing-gap metric further suggests that the headline mismatch cannot be explained by that indicator alone.
This is therefore best understood as an operational cross-border flow story, rather than simply a balancing-market story.
Revenue Insight
Market Outlook
For subsequent weeks, three developments would be especially informative: whether the average absolute deviation remains near the Week 9 level of roughly 10.6 GW, whether repeated 20+ GW events continue to occur, and whether those events begin to show stronger relationships with balancing, congestion or price indicators.
A reduction in both event duration and mismatch energy would indicate improved alignment. Continued high deviations combined with elevated balancing or intraday price signals, however, would strengthen the case that cross-border physical-flow conditions are translating into broader market stress.
Week 9 therefore establishes a useful benchmark: 24.2 GW peak mismatch, 10.6 GW average absolute deviation, seven persistent events and 577.7 GWh of absolute mismatch energy.
Simulation Note
Written by
Dr. G. O. C. Okwuibe
Quantitative Energy Systems Expert | Electricity Market & BESS
Dr. Godwin Okwuibe is a quantitative energy system expert specializing in electricity markets, battery storage optimization, and flexibility market design. His work focusses on translating complex market dynamics into actionable insights for industry stakehold...