
 Dr. G. O. C. Okwuibe
Import Dependency Event — Week 20, 2026
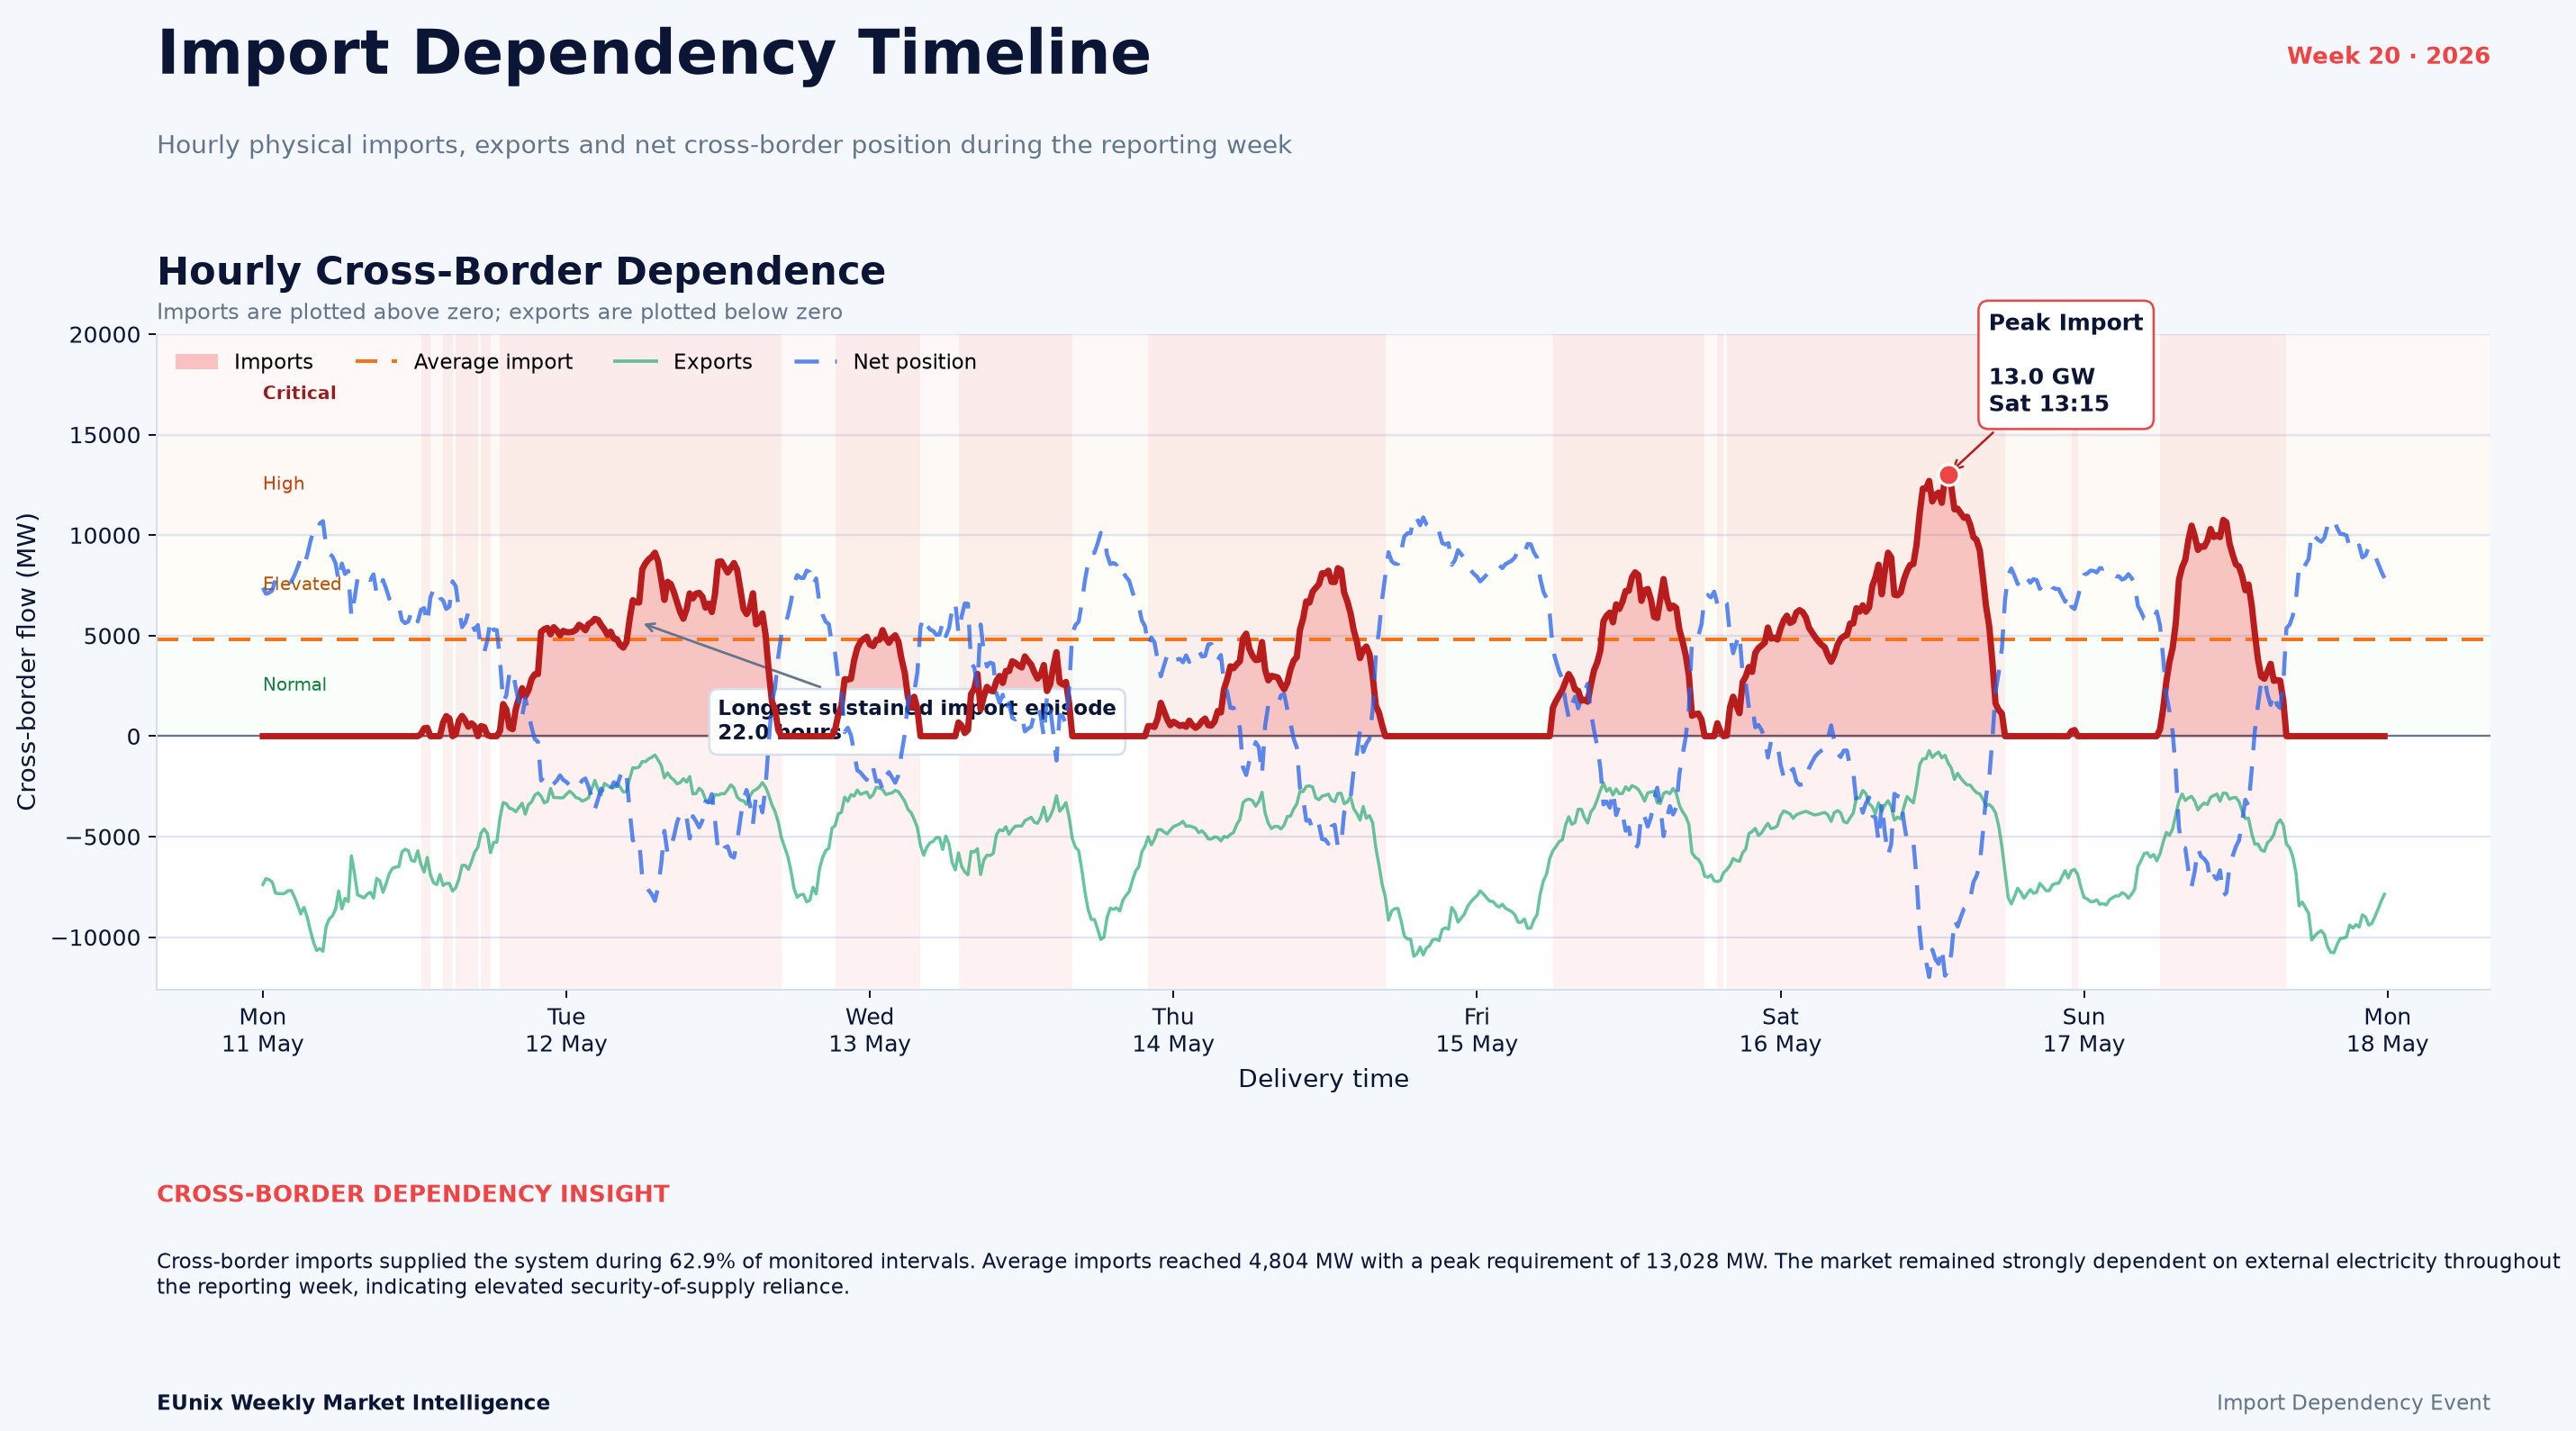
Germany relied on cross-border imports during a substantial share of Week 20, with EUnix Market Intelligence identifying import dependence across 62.95% of monitored intervals and a maximum physical import requirement of 13,028.5 MW. Imports were not constant, however: the system alternated repeatedly between import and export conditions, and total weekly exports exceeded imports. The strongest import episode occurred on Saturday, 16 May, while the Netherlands emerged as the largest individual import source.
Charts
Market Overview
The story received a priority score of 88.24, supported by a detection strength of 85.23% and confidence of 83.97%.
The central signal was a maximum physical import requirement of 13,028.5 MW, while imports were present during approximately 62.95% of monitored intervals, equivalent to 105.75 hours.
Estimated gross imported electricity reached 508 GWh during the week. At the same time, the daily-energy analysis shows approximately 887 GWh of exports, resulting in -379 GWh net imported energy on the chart's gross import-minus-export basis.
This distinction is important: Week 20 exhibited frequent and sometimes large import requirements, but Germany was not a net importer over the complete weekly energy balance shown in the charts. Instead, the system shifted materially between cross-border importing and exporting conditions.
The supporting analytics reinforce the significance of these cross-border movements. Scheduled imports scored 93.83, import dependency 93.42, and net position 55.12.
Key Observations
Interpretation
Imports occurred during nearly two-thirds of monitored intervals and occasionally exceeded 13 GW, which means cross-border supply played an important operational role. Yet aggregate weekly exports were substantially larger than aggregate imports.
Germany therefore moved between two different system states during the week: periods in which neighbouring markets supplied significant power into Germany, and other periods in which Germany exported substantial volumes outward.
This is characteristic of an increasingly interconnected European electricity system. Cross-border flows respond to changing generation availability, renewable production, demand conditions, market prices and transmission opportunities rather than following a single fixed direction throughout the week.
An especially interesting result is the relationship between imports and residual load.
The supplied analysis shows a correlation coefficient of approximately -0.86 between physical imports and residual load. In other words, higher residual-load conditions were generally associated with lower imports during this particular week.
That is counterintuitive if imports are assumed simply to cover domestic generation shortages.
Instead, the data suggest that Week 20 imports were being driven by a broader cross-border market condition rather than solely by domestic residual-demand pressure. This makes the event particularly relevant from a market-integration perspective.
The strongest imports occurred while residual load was relatively low, whereas several high-residual-load periods coincided with limited physical imports. The relationship therefore appears more consistent with changing regional market conditions and cross-border optimisation than with straightforward domestic adequacy support.
Revenue Insight
Market Outlook
Week 20 recorded import exposure across 62.95% of monitored intervals, but peak imports remained below the 15 GW critical threshold used by the heatmap analysis. This suggests substantial reliance without evidence from the supplied charts of an extreme cross-border stress episode.
Future weeks would become more significant if several indicators rise simultaneously: import dependency ratio, peak physical imports, duration of sustained import episodes and supplier concentration.
The Dutch border deserves particular attention. With approximately one-third of the measured border-level imported energy and the largest observed border contribution, changes in Dutch generation, demand or market conditions could materially change Germany's import profile.
The strong -0.86 relationship between imports and residual load should also be watched. If this pattern persists, it would strengthen the interpretation that imports are increasingly responding to regional market optimisation rather than simply domestic scarcity.
The broader Week 20 message is therefore nuanced: Germany used cross-border imports extensively, but those imports formed part of a strongly bidirectional European electricity exchange rather than evidence of persistent weekly net import dependence.
Simulation Note
Written by
Dr. G. O. C. Okwuibe
Quantitative Energy Systems Expert | Electricity Market & BESS
Dr. Godwin Okwuibe is a quantitative energy system expert specializing in electricity markets, battery storage optimization, and flexibility market design. His work focusses on translating complex market dynamics into actionable insights for industry stakehold...