
 Dr. G. O. C. Okwuibe
Midday Collapse, Evening Recovery: Germany’s Flexibility Challenge Intensified — Week 30, 2026
Germany’s power system showed a pronounced duck-curve pattern in Week 30, with deep midday residual-load suppression followed by steep evening recovery. The EUnix Intelligence Platform ranked Duck Curve and Flexibility Stress as the week’s leading story with a priority score of 88.05, detection strength of 95.32%, and confidence of 79.69%. The story-level analytics identified a maximum duck depth of 55.2 GW, a maximum evening-ramp metric of 42.0 GW, and 68 critical residual-ramp intervals.
Charts
Market Overview
The intraday system profile shows the clearest expression of this pattern. Renewable generation climbed above 50 GW around the late-morning and midday period, while residual load fell below zero between roughly 10:00 and 13:00. The highest daily renewable share reached 68.9% on Sunday, 26 July.
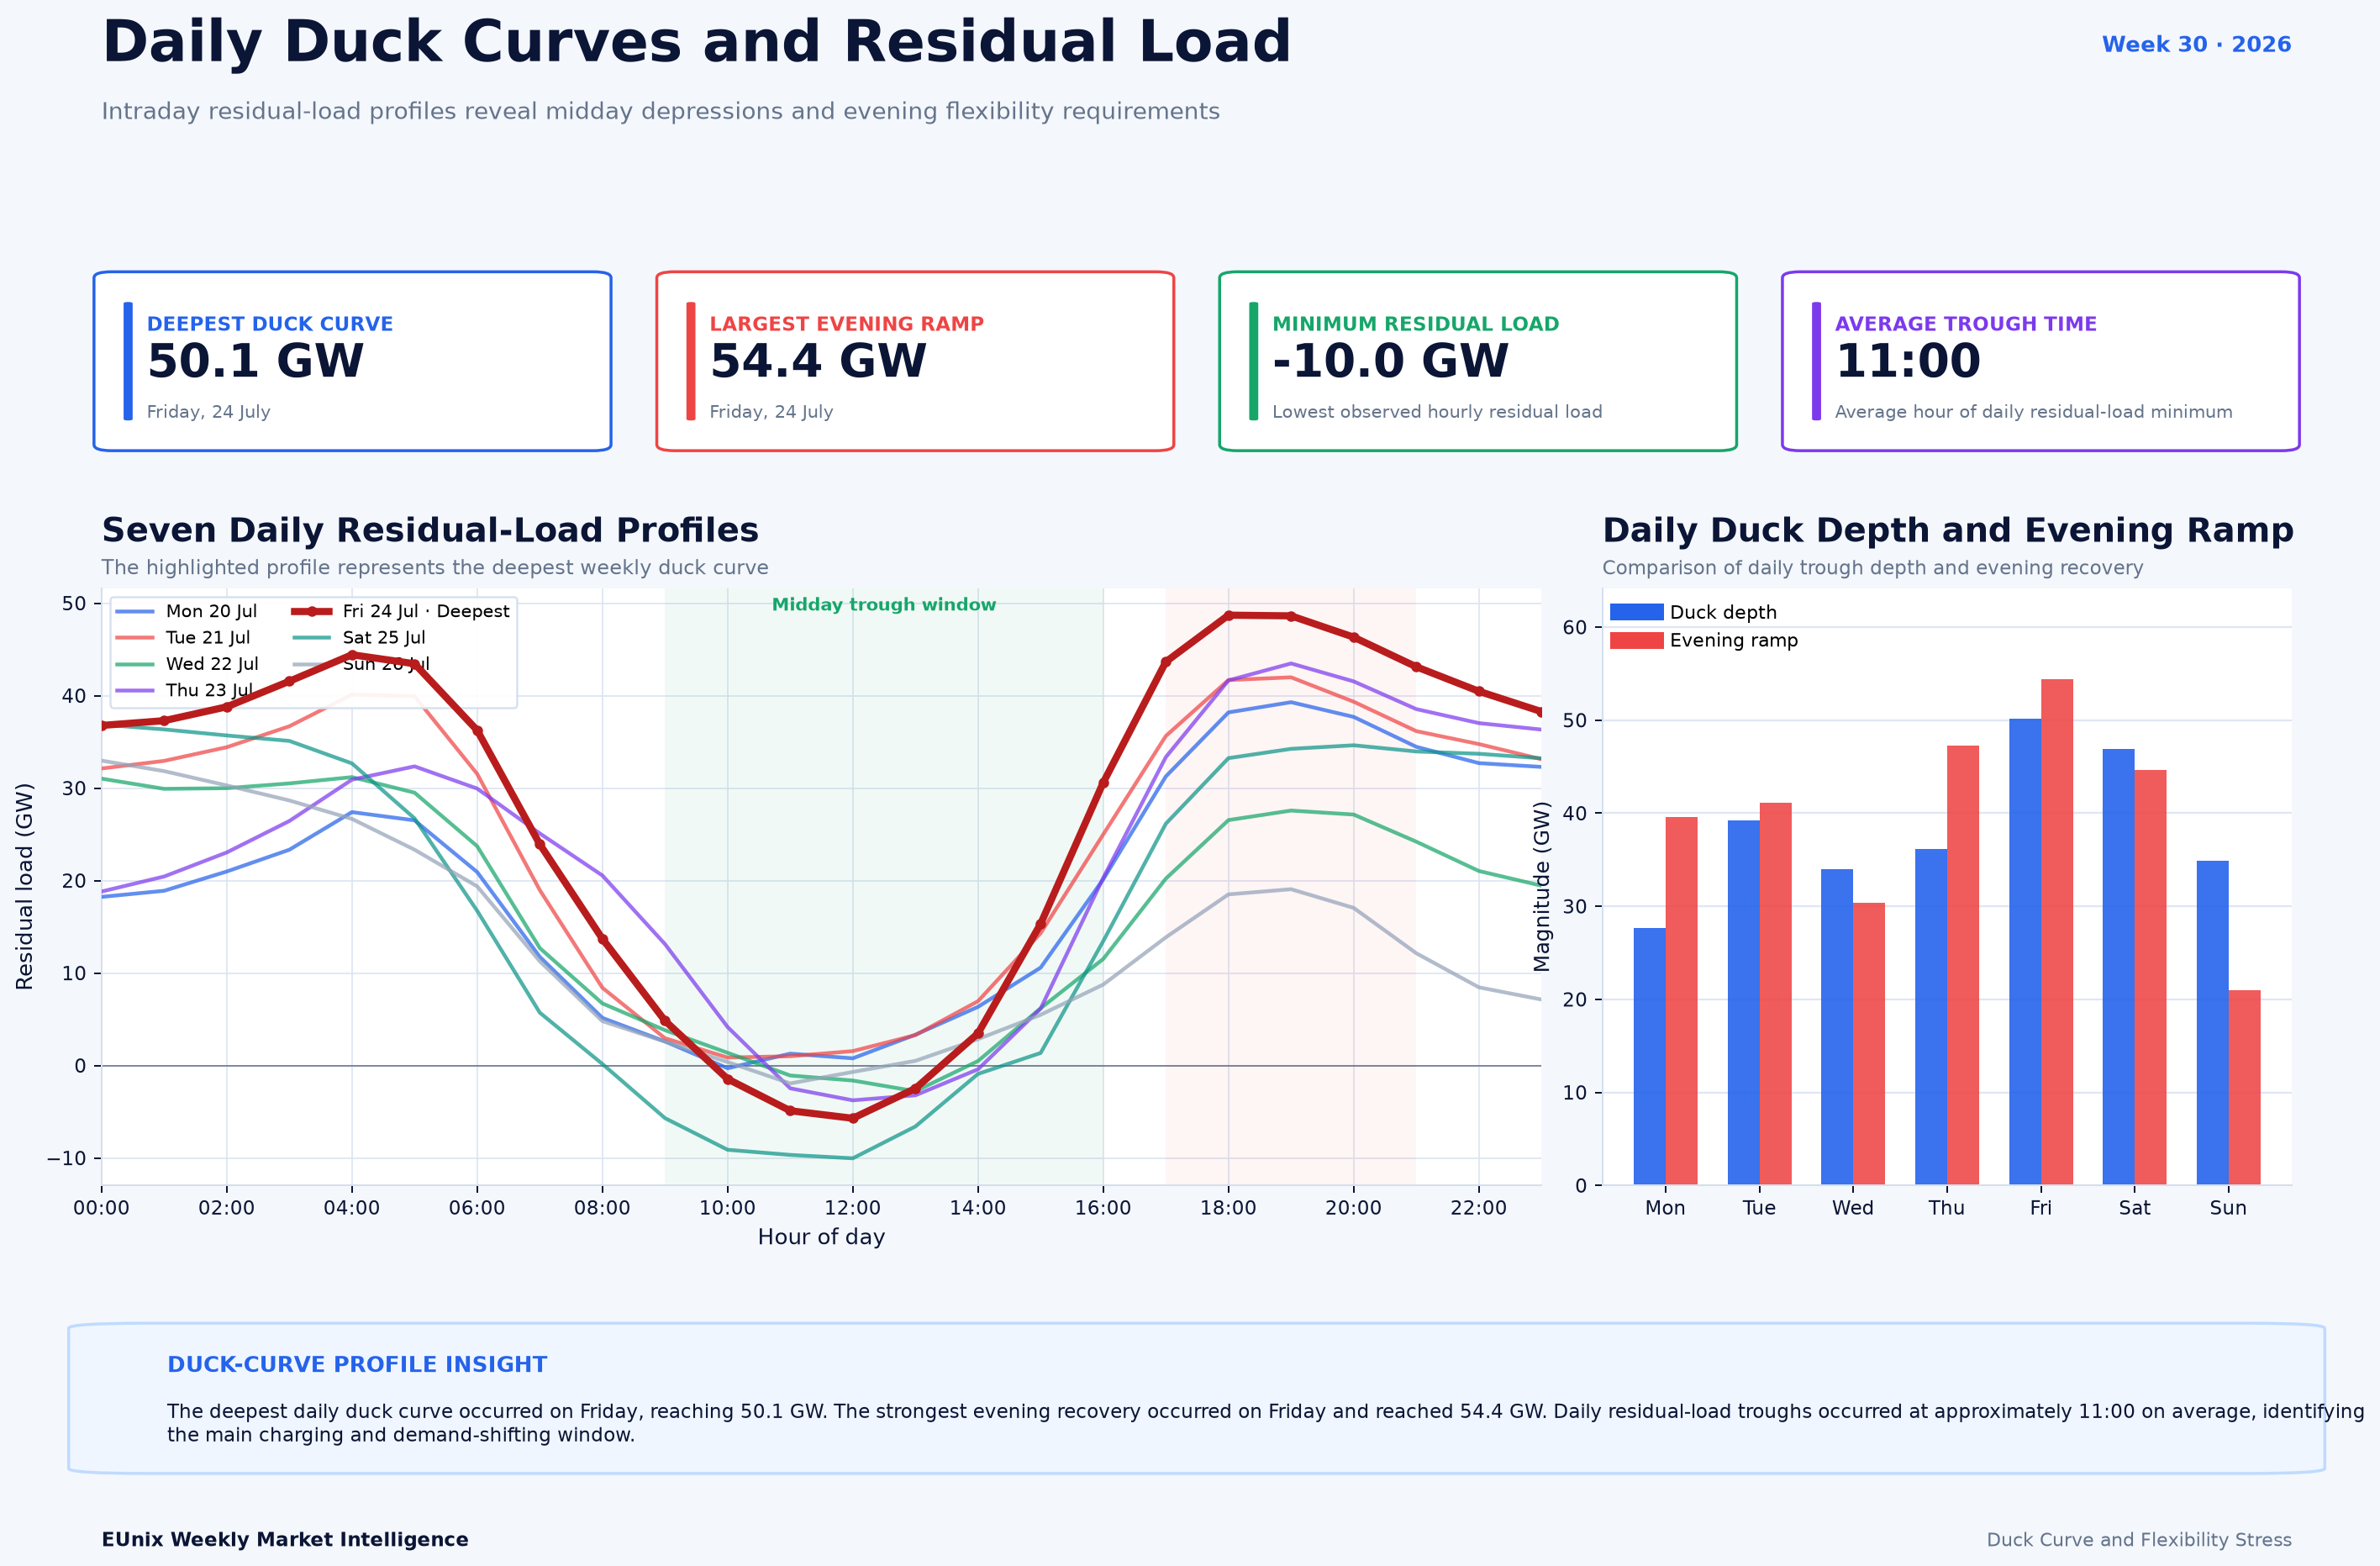
The daily-profile analysis shows that Friday, 24 July produced the deepest individual duck curve at 50.1 GW and the strongest daily evening recovery at 54.4 GW. The minimum observed hourly residual load across the profiles reached approximately -10.0 GW, while the average daily trough occurred at around 11:00.
Flexibility pressure was not confined to the shape of the daily curve. The interval-level ramping analysis recorded a maximum upward residual-load ramp of 17.2 GW/h on Thursday at 16:00 and a maximum downward ramp of 18.8 GW/h on Friday at 07:00. A total of 68 intervals crossed the weekly critical-ramp threshold of 10.0 GW/h.
The EUnix analytics strongly supported the flexibility narrative. duck_curve scored 94.16, demand_response_opportunity 90.33, storage_utilization 68.09, and ramping 65.21. The weekly flexibility requirement was assessed as Critical at 88.0/100.
Key Observations
Interpretation
The daily profiles make this transition particularly visible. Friday moved from a strongly depressed midday residual load into the week’s largest evening recovery. That same day also produced the deepest duck curve and was classified among the most stressed periods in the ramping analysis.
The system was therefore managing two opposite flexibility requirements within the same daily cycle. During the morning and midday transition, downward flexibility was needed as residual load collapsed. Later in the day, upward flexibility became necessary as the system moved toward its evening recovery.
This helps explain why the ramping analysis should not be viewed separately from the duck curve. The 18.8 GW/h downward ramp and 17.2 GW/h upward ramp are operational manifestations of the same underlying intraday imbalance between renewable output and electricity demand.
The story-level 55.2 GW duck-depth and 42.0 GW evening-ramp metrics are broader analytical indicators, while the daily-profile chart reports a deepest single-day curve of 50.1 GW and strongest daily evening recovery of 54.4 GW. They should therefore be interpreted according to their respective analytical definitions rather than treated as interchangeable measurements.
Revenue Insight
Market Outlook
The second is the speed of the evening recovery. Friday’s 54.4 GW daily recovery shows that deep midday suppression can be followed by a very large requirement several hours later. If these swings become more frequent, flexibility requirements will increasingly be determined by ramp rate rather than peak demand alone.
Critical ramp frequency should also remain under observation. Week 30 produced 68 critical intervals, while the hourly heatmap showed 15 critical cells and four extreme cells. Repeated clustering around the late afternoon would strengthen the case for flexibility targeted specifically at the evening transition.
Finally, the relative strength of the analytics is important. Duck-curve detection at 94.16 and demand-response opportunity at 90.33 were considerably stronger than the standalone ramping score of 65.21. This suggests that the most useful interpretation of Week 30 is not simply “high ramps,” but a broader renewable-integration pattern in which midday surplus conditions are creating increasingly valuable flexibility windows.
Simulation Note
Written by
Dr. G. O. C. Okwuibe
Quantitative Energy Systems Expert | Electricity Market & BESS
Dr. Godwin Okwuibe is a quantitative energy system expert specializing in electricity markets, battery storage optimization, and flexibility market design. His work focusses on translating complex market dynamics into actionable insights for industry stakehold...