
 Dr. G. O. C. Okwuibe
Net Exporter for the Week, Import-Dependent by the Weekend: Germany’s 16.1 GW Cross-Border Reversal — Week 24, 2026
Germany’s cross-border position told two different stories in ISO Week 24. Across the full week, exports reached 1,120 GWh against 472 GWh of imports, leaving net imported energy at -647 GWh. Yet import dependence intensified sharply late in the reporting period: imports were required during 44.6% of monitored intervals, the longest sustained import episode lasted 43.5 hours, and physical imports peaked at 16.1 GW on Saturday, 13 June. EUnix therefore classified the event as Critical, with a priority score of 88.53/100 and confidence of 88.53%.
Charts
Market Overview
The most striking feature was not persistent dependence throughout all seven days, but the sharp change in the market regime toward the weekend. From Monday through Friday, physical imports were generally limited and intermittent. From early Saturday, however, imports rose rapidly and remained elevated through much of Sunday, producing a 43.5-hour sustained import episode.
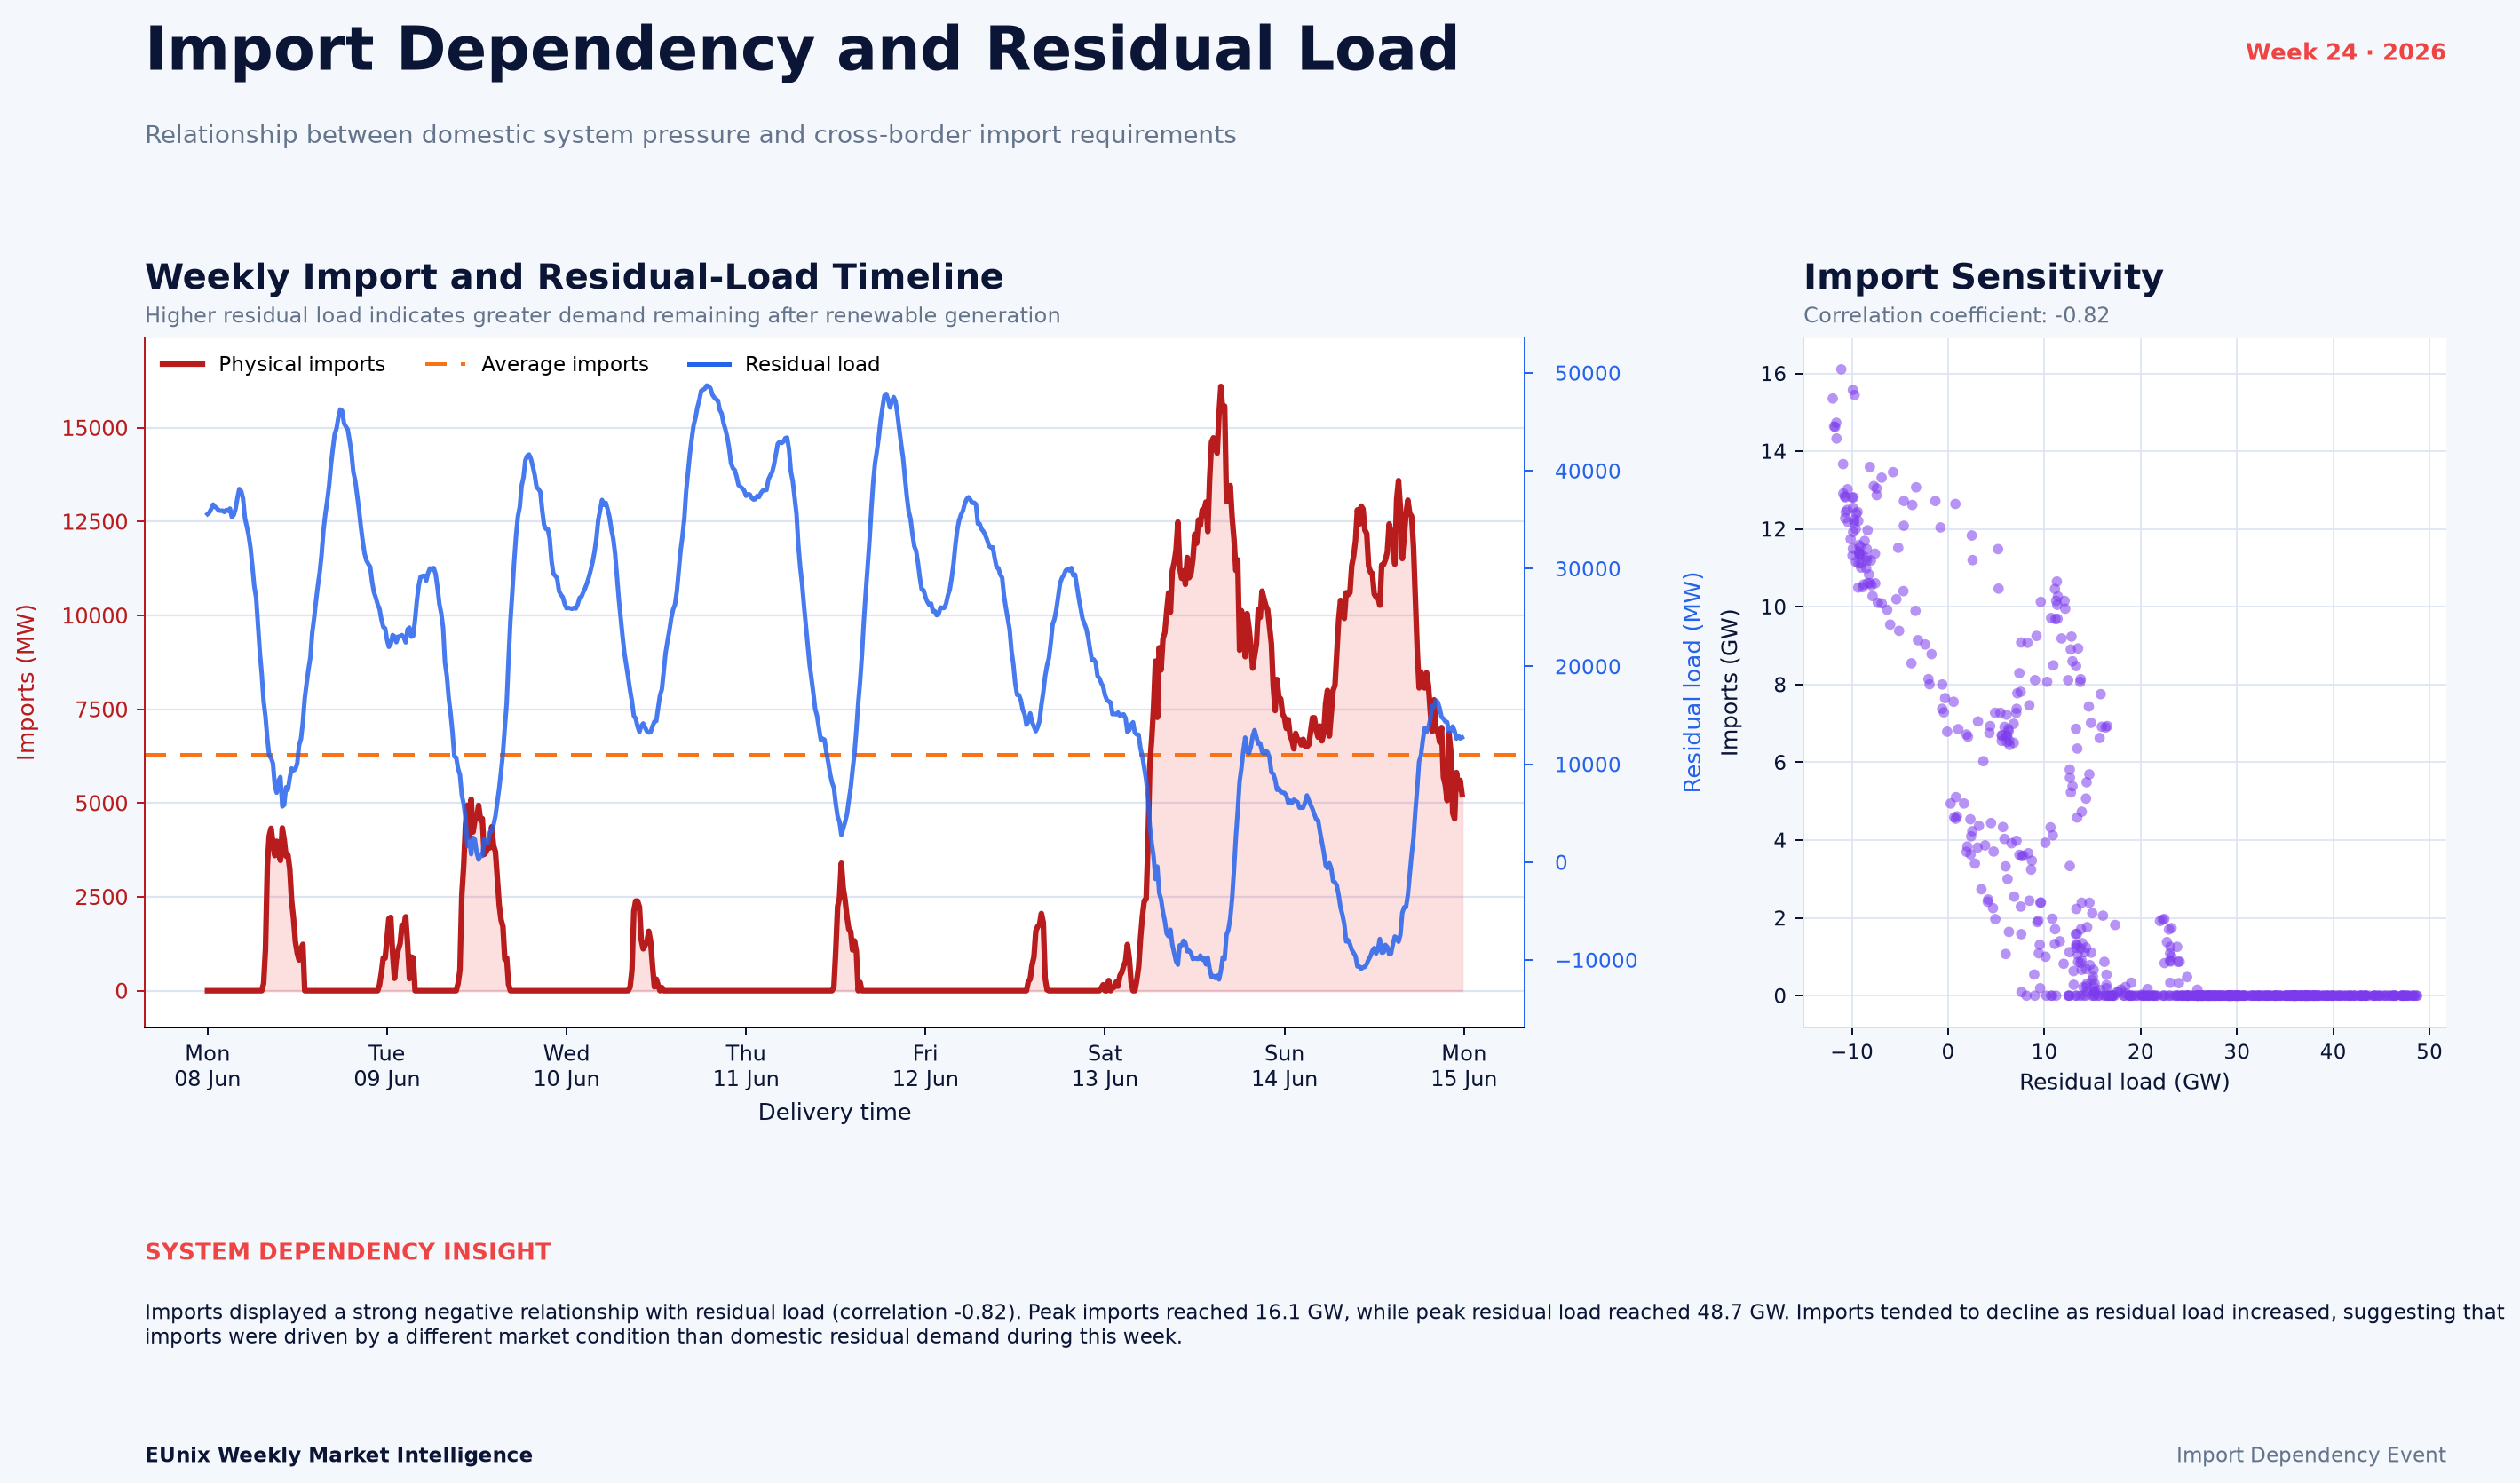
Maximum physical imports reached 16,106 MW, while the supplied analytical summary reports 75 import-dependent hours, equivalent to 44.64% of monitored intervals. The headline summary gives average imports of 2,811 MW across the reporting basis, while the import-dependency timeline separately reports approximately 6,297 MW during the import-dependent operating periods. These describe different views of the week's import intensity rather than a single uniform operating condition.
The daily energy profile reinforces the abrupt weekend shift. Imports were only 16 GWh Monday, 27 GWh Tuesday, 5 GWh Wednesday, 6 GWh Thursday and 3 GWh Friday before increasing to roughly 200 GWh Saturday and 216 GWh Sunday. By contrast, exports dominated the earlier part of the week.
Despite the import event, Germany remained a net exporter on an energy basis for Week 24. Gross exports totalled 1,120 GWh, compared with 472 GWh of imports, resulting in net imported energy of -647 GWh. This makes Week 24 a story of temporal dependence rather than aggregate weekly dependence.
Key Observations
Interpretation
The transition is particularly visible in the timeline and heatmap. Import requirements were relatively small for much of Monday through Friday before increasing rapidly on Saturday. The heatmap then shows sustained high import intensity extending across Saturday and Sunday, with numerous hourly periods above 10 GW.
The relationship with residual load adds an important qualification. Imports had a correlation of -0.82 with residual load, meaning the largest imports did not coincide with the highest domestic residual-load conditions. The supplied analysis therefore indicates that Week 24's import behaviour was likely associated with a broader cross-border market condition rather than being explained simply by high domestic residual demand.
This distinction matters when interpreting “dependency.” The data do not show Germany continuously relying on imports for the entire week. Instead, they show a system capable of exporting large quantities over one part of the week and then requiring substantial external supply for an extended period later.
The border mix also suggests that the import requirement was not concentrated exclusively in one interconnection. The Netherlands was the largest contributor, but its 22.8% share was followed closely by Poland at 19.6%, with the Czech Republic and Austria contributing 13.1% and 12.7% respectively.
Revenue Insight
Market Outlook
Particular attention should be paid to the combination of import duration and peak magnitude. Week 24 produced both: a sustained episode and a maximum physical import requirement of 16.1 GW. Repeated occurrences would strengthen the security-of-supply significance of the pattern.
The residual-load relationship also deserves continued monitoring. If imports repeatedly increase when residual load is low, the evidence would increasingly point toward cross-border market economics and regional generation conditions rather than purely domestic adequacy pressure.
Border concentration should also remain part of the assessment. The Netherlands currently leads at 22.8%, but the relatively distributed import mix means future changes in Poland, the Czech Republic, Austria or other interconnections could materially alter the pattern.
For Week 24, the central message is therefore not that Germany became structurally import dependent. It is that a market which was strongly export-oriented in aggregate shifted abruptly into a prolonged, high-volume import regime, demonstrating how quickly cross-border dependence can change within a single reporting week.
Simulation Note
Written by
Dr. G. O. C. Okwuibe
Quantitative Energy Systems Expert | Electricity Market & BESS
Dr. Godwin Okwuibe is a quantitative energy system expert specializing in electricity markets, battery storage optimization, and flexibility market design. His work focusses on translating complex market dynamics into actionable insights for industry stakehold...