
 Dr. G. O. C. Okwuibe
The Midday Trough Is Deepening — Week 33, 2026
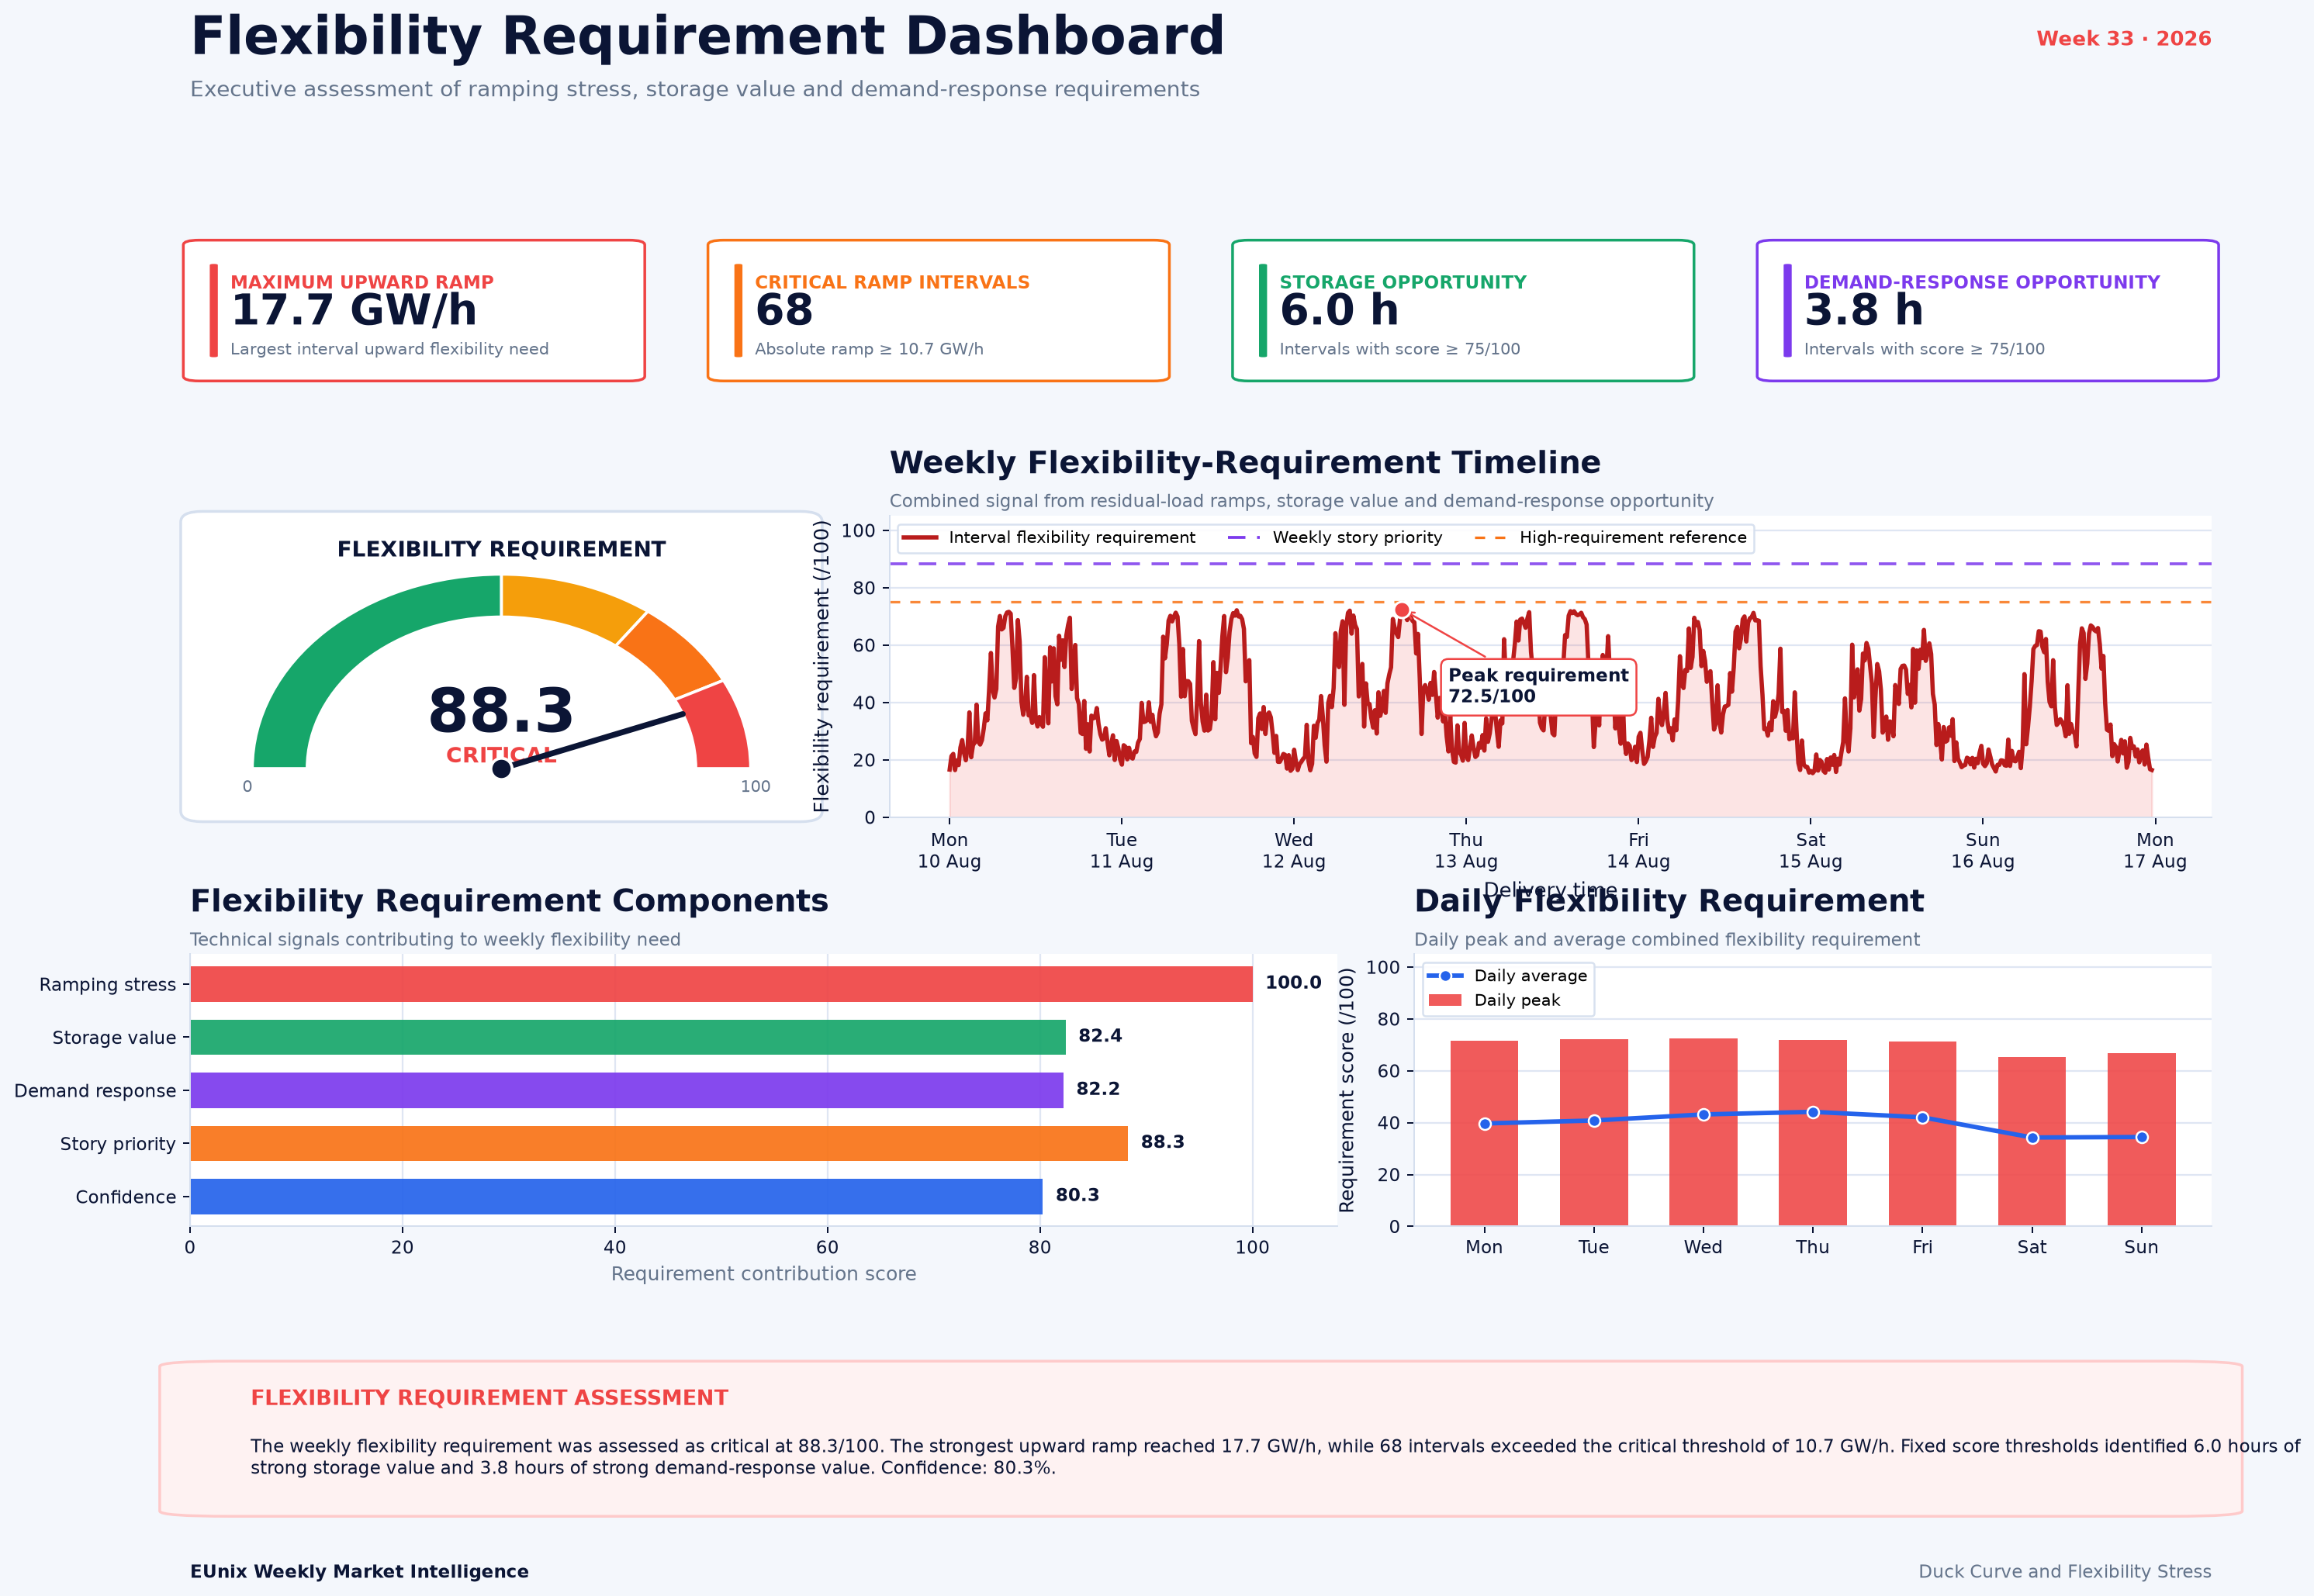
Germany’s power system showed another pronounced duck-curve pattern in Week 33. Residual load fell deeply through the middle of the day before recovering sharply into the evening, creating substantial flexibility requirements. The EUnix Intelligence Platform identified Duck Curve and Flexibility Stress as the week’s leading story, with a priority score of 88.29, detection strength of 95.44%, and confidence of 80.27%. The deepest daily duck curve reached 46.3 GW, while the strongest evening recovery reached 49.9 GW.
Charts
Market Overview
The deepest observed daily duck curve occurred on Wednesday, 12 August, reaching 46.3 GW. Across the full week, average duck depth was 38.8 GW, while the shallowest daily profile still reached 33.4 GW. This indicates that the midday depression was not confined to one exceptional day but remained structurally visible throughout the reporting period.
Renewables were central to this pattern. Average electricity demand was 48.5 GW, renewable generation averaged 27.3 GW, and average residual load stood at 21.2 GW. The highest daily renewable share reached 62.6%, while the minimum observed residual load fell to -7.2 GW.
The challenge shifted rapidly after the midday trough. The largest evening recovery reached 49.9 GW on Friday, while the strongest single upward residual-load ramp reached 17.7 GW/h. The strongest downward ramp was slightly larger at 18.0 GW/h.
These dynamics translated into sustained flexibility stress. The platform detected 68 critical residual-ramp intervals, with demand-response opportunity scoring 92.2/100, duck-curve analytics 93.0/100, ramping 73.7/100, and storage utilization 59.0/100.
Key Observations
Interpretation
The most important feature is therefore the transition between the trough and the evening peak. A deep residual-load minimum alone may be manageable, but when that low point is followed by a rapid recovery of almost 50 GW, the requirement for dispatchable flexibility becomes significantly more demanding.
The ramping analysis reinforces this point. Critical movements were concentrated particularly around the late afternoon, with the heatmap identifying 15:00 as the most stressed hour. Wednesday was the most stressed day, recording four critical hourly ramp cells.
The supplied demand-renewables-residual-load profile also shows how the shape emerges. Renewable generation rises rapidly through the morning, approaching total demand around midday and pushing residual load below zero, before declining in the afternoon as residual demand climbs sharply again.
This creates a two-sided flexibility requirement: the system needs assets capable of absorbing or shifting energy during the midday trough and assets capable of increasing supply or reducing demand during the subsequent recovery.
Revenue Insight
Market Outlook
The second critical indicator is the speed of the afternoon recovery. Week 33 demonstrated that the system can move from deeply suppressed residual load to substantial evening requirements within only a few hours. Large upward ramps therefore remain an important operational signal.
Periods in which renewable output approaches demand deserve particular attention because they can simultaneously reduce residual load, increase the attractiveness of storage charging and create a larger subsequent recovery requirement.
For flexible assets, the most valuable strategy is therefore likely to depend on timing rather than simply total daily energy. The Week 33 profiles show recurring midday and evening windows that differ substantially in operational value.
If similar patterns continue, flexibility providers capable of responding on both sides of the duck curve—absorbing energy during low-residual-load periods and supplying or reducing demand during the recovery—will be positioned to address the most visible system requirements.
Simulation Note
Written by
Dr. G. O. C. Okwuibe
Quantitative Energy Systems Expert | Electricity Market & BESS
Dr. Godwin Okwuibe is a quantitative energy system expert specializing in electricity markets, battery storage optimization, and flexibility market design. His work focusses on translating complex market dynamics into actionable insights for industry stakehold...