
 Dr. G. O. C. Okwuibe
When Electricity Flows Defy the Schedule: Germany's 22.3 GW Cross-Border Paradox — Week 44, 2026
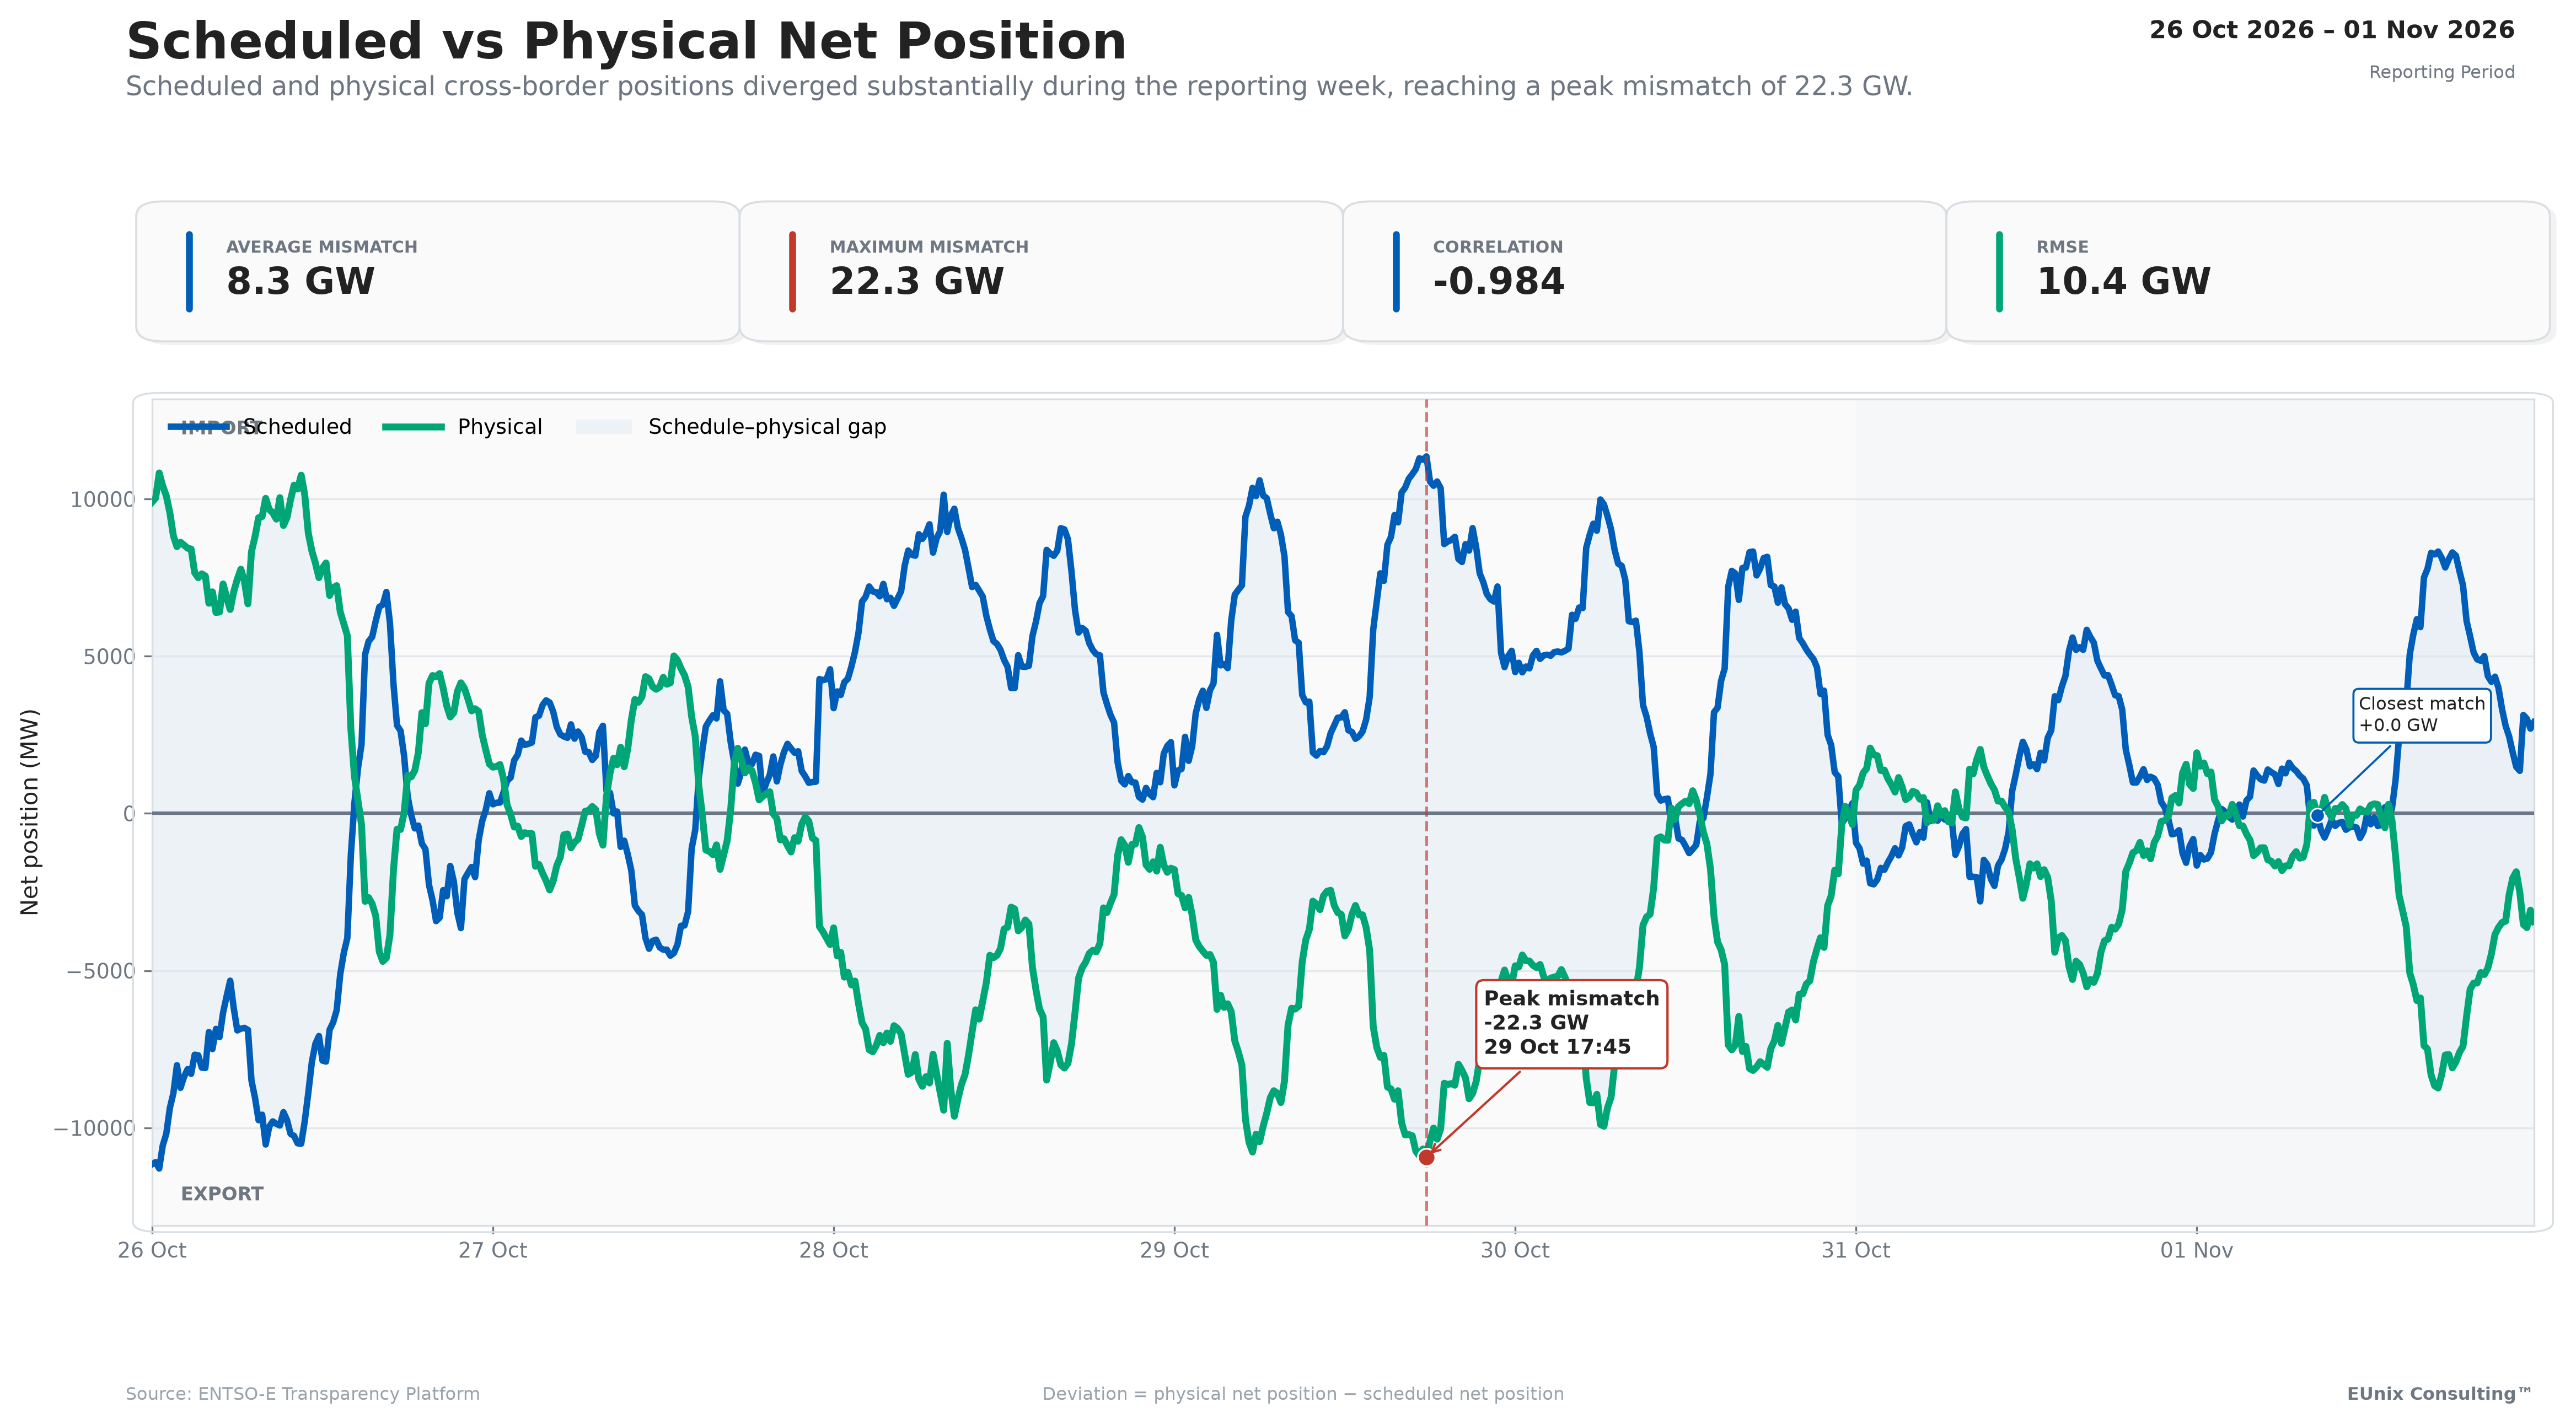
During Week 44 (26 October–1 November 2026), Germany's scheduled and physical cross-border electricity positions diverged sharply. EUnix Intelligence recorded an average absolute deviation of 8.3 GW and a peak mismatch of 22.3 GW on 29 October. The two positions exhibited a striking negative correlation of −0.984, while 97.8% of monitored intervals exceeded the 100 MW deviation threshold. The platform classified operational exposure as very high, raising questions about cross-border scheduling, physical flows and market coordination.
Charts
Market Overview
The divergence was persistent rather than limited to a few exceptional intervals. Of the 672 monitored 15-minute intervals, **657 intervals (97.8%) exceeded an absolute deviation threshold of 100 MW**. The platform consequently reported operational alignment of 0.0%, classified as poor. The root-mean-square error (RMSE) reached 10,422 MW, while the average signed deviation was −4,312 MW, indicating a tendency for the physical position to remain below the scheduled position under the platform's sign convention.
The largest mismatch occurred on **Thursday, 29 October, at 17:45 UTC**, when the physical net position was 22,291 MW below the scheduled position. Thursday also recorded the highest daily average absolute deviation of approximately 13.1 GW. Monday and Wednesday experienced elevated daily averages of 11.9 GW and 11.1 GW, respectively, while Saturday recorded the lowest daily average of 3.6 GW.
The event-detection analysis identified **10 persistent mismatch episodes**, with an average duration of 3 hours and 9 minutes. Four episodes were classified as extreme and collectively accounted for approximately 62% of the detected event energy. The largest episode lasted seven hours on 29 October, reached a peak deviation of 22.3 GW and contributed 131.5 GWh of cumulative absolute deviation. Total detected mismatch-event energy reached approximately 564.9 GWh.
At the border level, France was identified as the largest contributor to the observed mismatch, with an average absolute deviation of approximately 3,508 MW. However, the relationship between system-level schedule deviations and the reported border-balancing gap was weak, with a Pearson correlation of 0.13 and an R² of 0.02. The EUnix operational-risk assessment assigned a score of **80.5/100, classified as very high**, primarily reflecting the persistence and cumulative exposure associated with the observed deviations.
Key Observations
Interpretation
One important consideration is whether the scheduled and physical datasets use consistent geographical boundaries, aggregation rules and sign conventions. A negative correlation of −0.984 could reflect a genuine structural divergence between commercial and physical positions, but it could also arise from inconsistent import/export conventions or differences in how cross-border exchanges are aggregated. **The available charts do not establish which explanation is responsible.** Consequently, the observed mismatch should be treated as an analytical signal requiring validation rather than definitive evidence of scheduling failure.
The temporal distribution provides another important insight. Deviations were concentrated during several sustained episodes, particularly between 28 and 30 October. The largest event on 29 October lasted seven hours, indicating that the discrepancy was not simply a short-lived fluctuation. However, the persistence of a calculated difference does not necessarily mean that transmission system operators experienced an equivalent operational imbalance. Physical cross-border flows, scheduled exchanges and balancing-energy requirements represent different aspects of electricity-system operation.
This distinction is reinforced by the weak relationship between schedule deviation and the reported border-balancing gap. Despite system-level deviations exceeding 20 GW, the corresponding border-balancing gaps were generally much smaller. At the maximum mismatch, the balancing gap was approximately −0.4 GW. With an R² of only 0.02, the supplied analysis provides little evidence that the observed schedule deviations directly explain the variation in the reported balancing-gap measure.
The operational-risk classification of 80.5/100 therefore requires careful interpretation. It indicates that the EUnix scoring framework identified substantial deviation magnitude, persistence and cumulative mismatch exposure. It does not independently establish an actual electricity-system emergency. The most valuable conclusion is that **Germany's reported commercial and physical cross-border positions exhibited a structural inconsistency that deserves closer analytical examination**.
Revenue Insight
Market Outlook
The immediate analytical priority should be to verify the sign conventions, geographical coverage, temporal alignment and aggregation methods used to construct scheduled and physical net positions. This is particularly important given the −0.984 correlation, which suggests an almost perfectly opposing movement between the two series. Establishing whether the relationship is physical, methodological or a combination of both is essential before drawing stronger operational conclusions.
A second priority is to investigate the role of individual borders. France recorded the largest average absolute mismatch, making it a useful starting point for a more detailed assessment of scheduled exchanges and physical electricity flows. Border-level reconciliation could help determine whether the system-wide discrepancy is concentrated in particular interconnections or distributed across the network.
For electricity-market participants, the findings support closer integration of commercial schedules, physical-flow observations and balancing-market indicators into forecasting and risk-management processes. However, the weak statistical relationship between the observed deviations and the reported border-balancing gap suggests that these indicators should be evaluated separately before being incorporated into automated trading or operational strategies.
**The central lesson from Week 44 is that a large difference between scheduled and physical electricity flows is not necessarily the same as a large power-system imbalance.** Understanding that distinction is essential for reliable market intelligence. Without consistent definitions and validated data, even statistically striking results can lead to misleading conclusions about electricity-system security, market exposure and flexibility requirements.
Simulation Note
Written by
Dr. G. O. C. Okwuibe
Quantitative Energy Systems Expert | Electricity Market & BESS
Dr. Godwin Okwuibe is a quantitative energy system expert specializing in electricity markets, battery storage optimization, and flexibility market design. His work focusses on translating complex market dynamics into actionable insights for industry stakehold...