
 Dr. G. O. C. Okwuibe
When €900/MWh Prices Met Midday Lows, Batteries Found the Week’s Trade — Week 26, 2026
Germany’s wholesale market delivered an unusually strong battery-arbitrage setup in ISO Week 26. Prices ranged from -€3.5/MWh to €900/MWh, producing a maximum daily arbitrage spread of €844.9/MWh and 34.25 hours of strong opportunity. A 1 MW / 1 MWh battery simulation converted selected windows into €672 gross weekly revenue, despite only 2.7 equivalent cycles.
Charts
Market Overview
Wholesale prices averaged €142.6/MWh over the week, but that average conceals exceptionally wide intraday movements. The weekly maximum reached €900/MWh, while the minimum fell only modestly below zero to -€3.5/MWh. The key arbitrage driver was therefore not persistent negative pricing, but the distance between low charging periods and extreme high-price discharge windows.
The daily arbitrage-spread analysis reinforces this point. The average daily spread was €423.6/MWh, while Wednesday produced the week's exceptional €844.9/MWh maximum. Monday and Tuesday also offered spreads of roughly €500/MWh or more, whereas conditions weakened considerably toward the weekend, reaching a weekly daily minimum of €184.9/MWh on Sunday.
The opportunity timeline shows a recurring operational pattern: charging conditions concentrated largely around late morning and midday, followed by stronger discharge signals during the late afternoon and evening. This temporal separation created the basic economic architecture required for energy arbitrage.
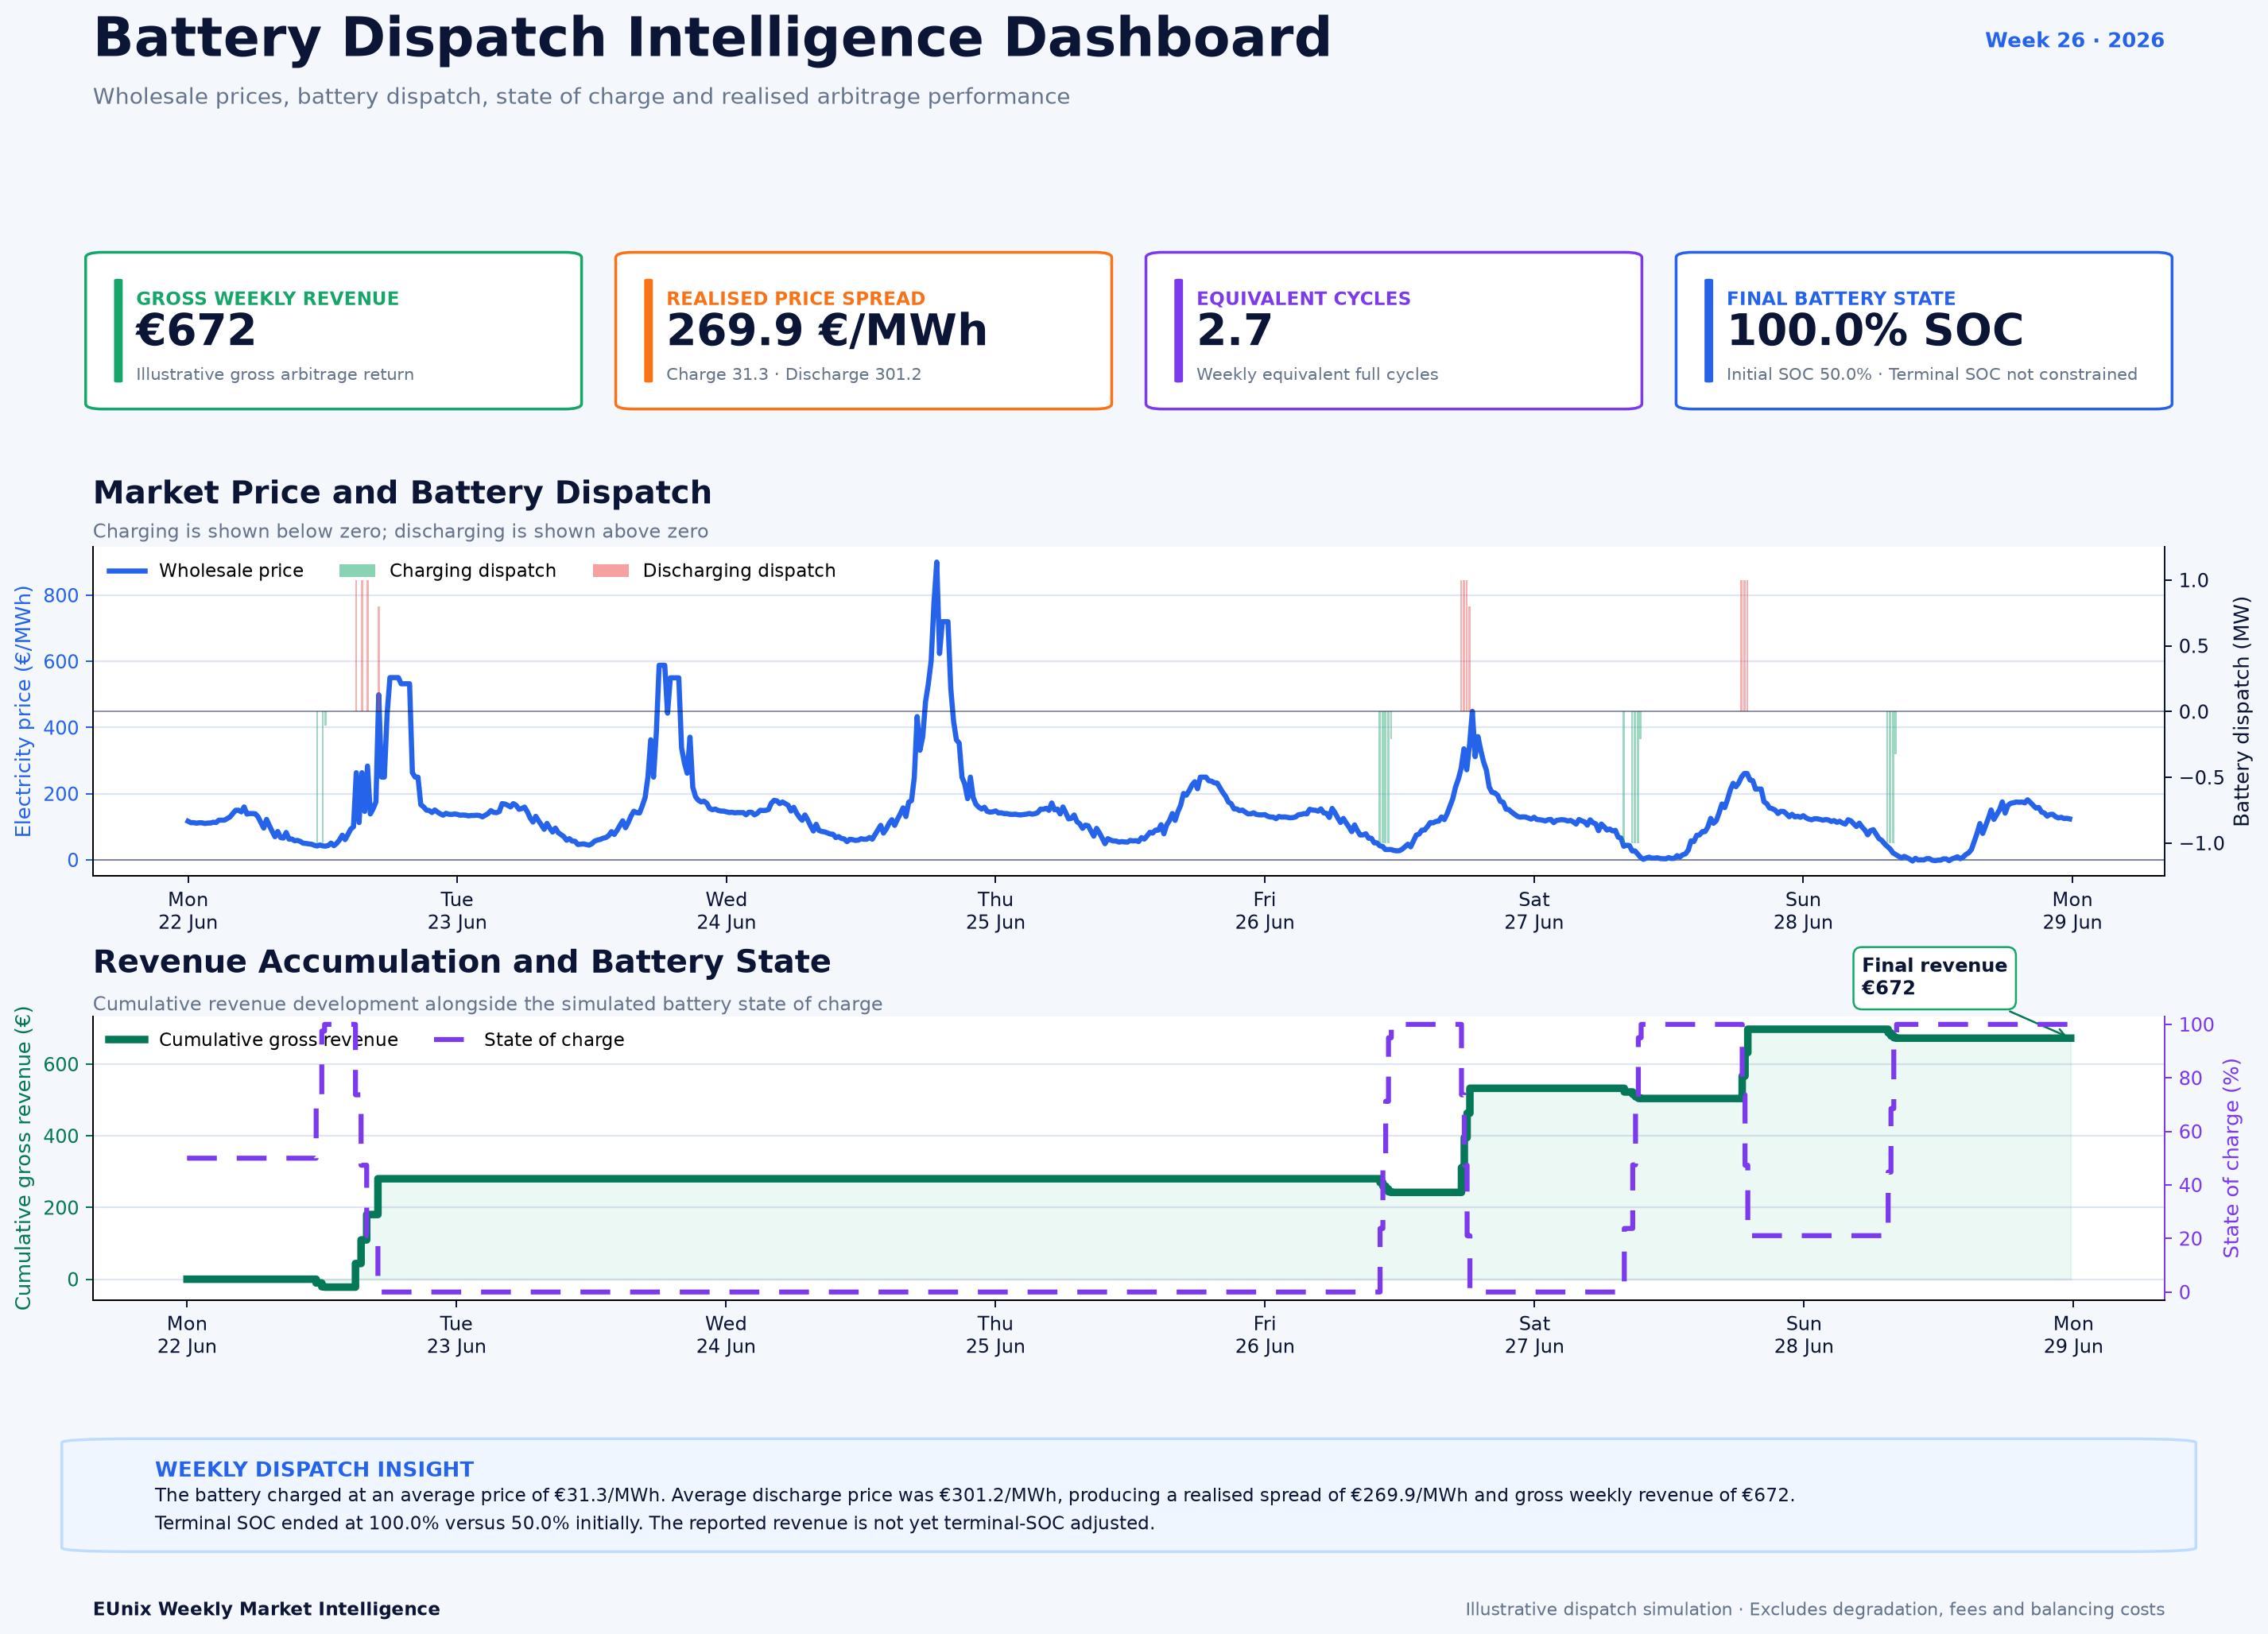
The illustrative battery simulation used these windows selectively rather than cycling continuously. Across the week, the battery charged 3.46 MWh, discharged 2.65 MWh, completed 2.7 equivalent cycles, and ended at 100% state of charge.
Key Observations
Interpretation
The weekly minimum was only -€3.5/MWh, yet the maximum daily spread reached €844.9/MWh because the opposite side of the market moved dramatically higher. The €900/MWh weekly peak therefore contributed far more to the week's arbitrage story than negative pricing alone.
The opportunity timeline also shows that the market repeatedly produced a familiar daily structure. Lower-price charging conditions emerged around the middle of the day, while stronger discharge opportunities appeared later. That recurring separation improves the operational usefulness of volatility because it creates identifiable windows rather than isolated random price movements.
At the same time, the simulation shows why the headline spread should not be interpreted as an automatically realisable battery margin. The theoretical maximum daily spread was €844.9/MWh, but the simulated asset realised an average spread of €269.9/MWh. Capacity, timing, efficiency and state-of-charge constraints determine how much of the headline market spread can actually be captured.
This makes Week 26 less a story about simply “buying negative and selling high” and more a story about dispatch discipline under extreme volatility.
Revenue Insight
Market Outlook
Daily spread behaviour also deserves attention. Week 26 moved from spreads above €500/MWh early in the week and €844.9/MWh on Wednesday to below €200/MWh by Sunday. Such dispersion means the economics of battery operation can change substantially from one day to the next.
The recurring midday charging and evening discharge pattern is another important signal. If that separation persists, storage operators may continue to encounter structured intraday opportunities even when outright negative-price frequency remains low.
However, the gap between the €844.9/MWh maximum observed spread and the €269.9/MWh realised simulated spread should remain central to performance assessment. Headline volatility measures market potential; dispatch optimisation determines capture.
Week 26 therefore reinforces a broader storage-market lesson: the strongest battery weeks may increasingly be defined not by how often prices fall below zero, but by how violently the market travels between its low- and high-price states.
Simulation Note
Written by
Dr. G. O. C. Okwuibe
Quantitative Energy Systems Expert | Electricity Market & BESS
Dr. Godwin Okwuibe is a quantitative energy system expert specializing in electricity markets, battery storage optimization, and flexibility market design. His work focusses on translating complex market dynamics into actionable insights for industry stakehold...