
 Dr. G. O. C. Okwuibe
When Midday Demand Collapsed, Flexibility Became the Scarce Asset — Week 25, 2026
Germany’s residual-load profile again displayed a pronounced duck-curve pattern in ISO Week 25, with the supplied analysis identifying a maximum weekly duck depth of 52.1 GW, 68 critical residual-ramp intervals, and a flexibility requirement score of 88.7/100. The most operationally important feature was the repeated transition from negative midday residual load into steep afternoon and evening recovery, with the strongest interval-level upward ramp reaching 17.5 GW/h. Storage and demand response therefore emerged as complementary flexibility resources.
Charts
Market Overview
The system-level profile shows average electricity demand of 51.3 GW, average renewable generation of 25.5 GW, and average residual load of 25.8 GW. Renewable output was sufficiently strong to push residual load deeply downward around the middle of the day, while the highest daily renewable share reached 75.4% on Monday, 15 June.
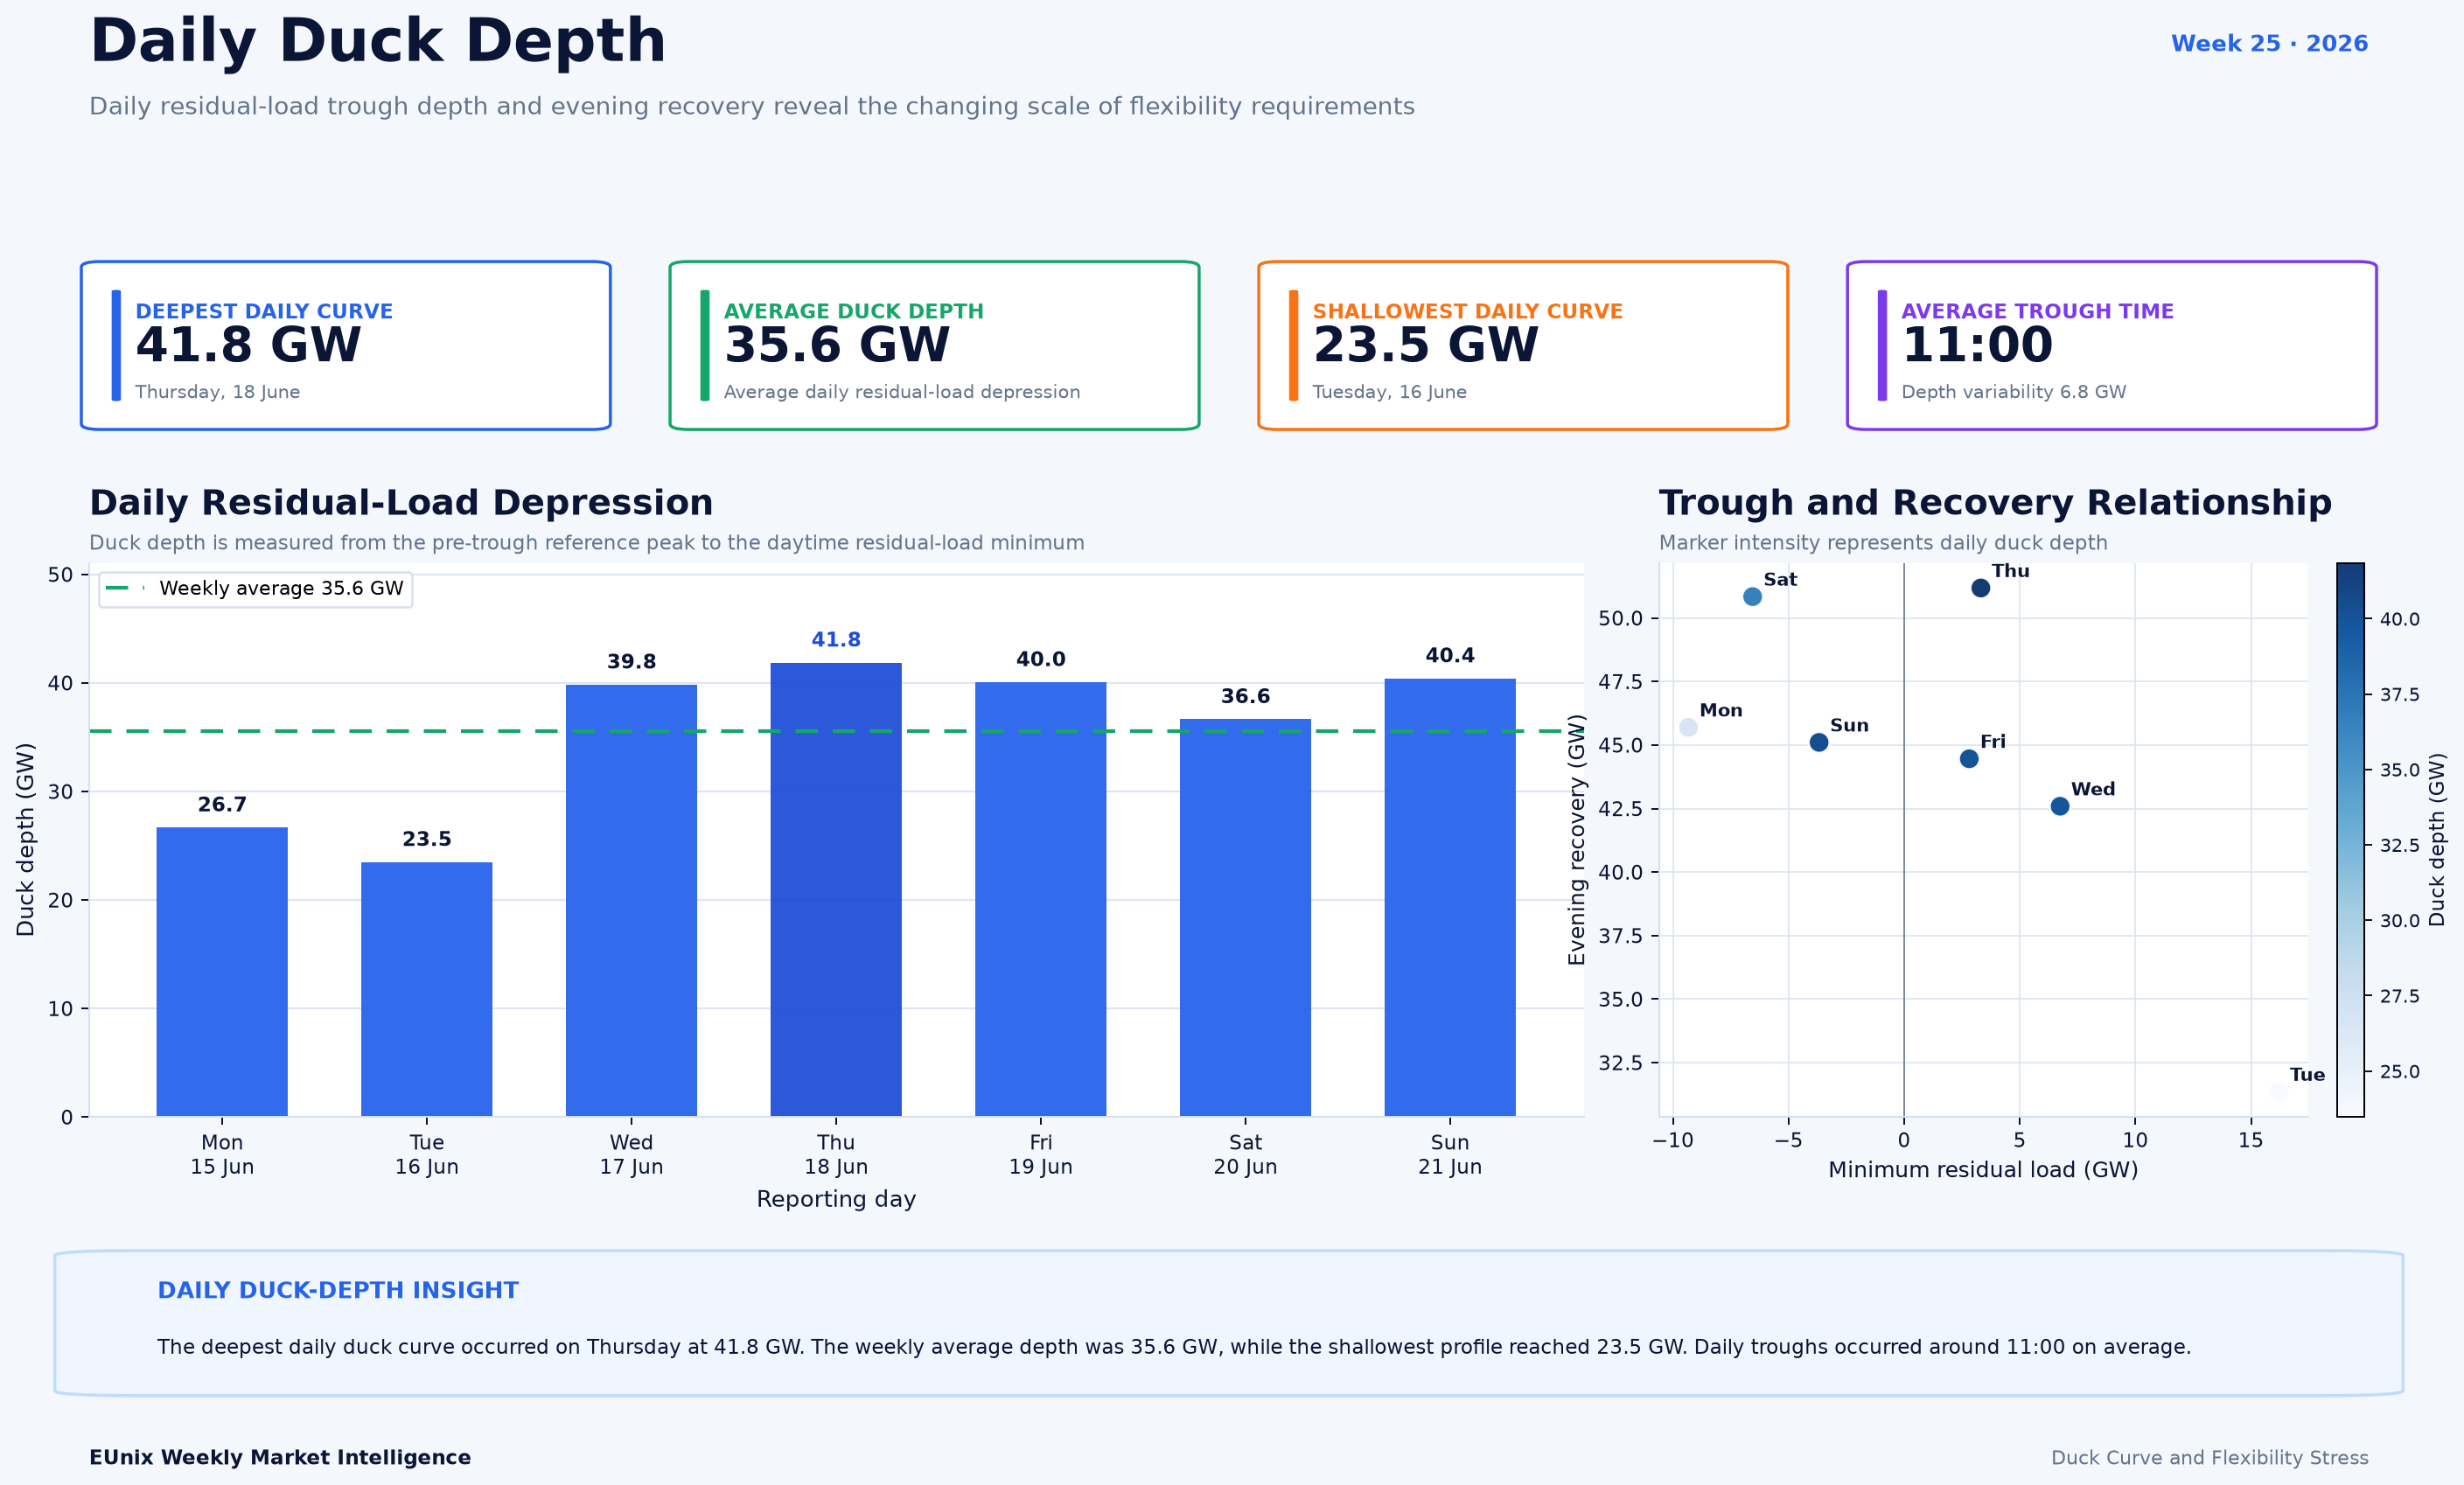
The detailed duck-curve analysis shows an average daily duck depth of 35.6 GW, with the deepest daily profile reaching 41.8 GW on Thursday, 18 June. The shallowest daily curve was still 23.5 GW on Tuesday, confirming that the intraday depression was not a one-day anomaly but a recurring feature across the week.
The supplied weekly summary reports a maximum duck depth of 52.1 GW and a maximum evening ramp of 36.8 GW, while the daily-profile chart separately identifies Thursday as the deepest daily profile at 41.8 GW and the strongest daily evening recovery at 51.2 GW. These represent different analytical measures within the supplied dashboards rather than interchangeable values.
At interval level, the largest upward residual-load ramp reached 17.5 GW/h on Wednesday at 16:00, while the strongest downward ramp reached 14.7 GW/h on Friday at 07:00. The analysis detected 68 critical ramp intervals, highlighting how frequently the system moved through elevated flexibility conditions.
Key Observations
Interpretation
During the morning, renewable generation rose rapidly and displaced residual demand, pushing residual load toward zero and, in some periods, below zero. Around midday, this created the deepest part of the duck curve and increased the potential value of flexible charging, load shifting and renewable absorption.
The system then faced the opposite problem several hours later. As renewable output declined while demand remained elevated, residual load recovered quickly. The upward ramp around the late afternoon became the more operationally demanding side of the profile, with the supplied ramping analysis identifying 16:00 as the most stressed hour and a peak upward ramp of 17.5 GW/h.
This is why storage and demand response appear together in the analysis. Storage can absorb electricity during low-residual-load conditions and return it later, while demand response can reduce or shift consumption during periods of upward system stress. Their value comes from solving different sides of the same intraday imbalance.
The Week 25 pattern therefore reflects a broader flexibility problem: increasing renewable penetration does not only change the level of residual demand; it changes its shape, timing and rate of movement. Those characteristics determine how difficult the system becomes to operate.
Revenue Insight
Market Outlook
The persistence of negative or near-zero residual-load periods is particularly important. If these conditions become more frequent, the value of resources capable of absorbing electricity during renewable-output peaks is likely to increase within the framework of the supplied flexibility analysis.
At the same time, the late-afternoon ramp should remain a central operational indicator. Week 25's largest upward interval ramp of 17.5 GW/h and repeated critical-ramp events show that the system can move from abundance to tightness very quickly.
Demand-response opportunity also deserves close attention. Its analytical priority score of 95.27 was slightly higher than the duck-curve score itself, indicating that responsive demand was one of the strongest operational responses identified by the EUnix analysis this week.
Overall, Week 25 reinforces a recurring system message: as renewable output reshapes the intraday profile, flexibility increasingly becomes valuable not because energy is scarce across the entire day, but because the system must move between surplus-like and high-requirement conditions within only a few hours.
Simulation Note
Written by
Dr. G. O. C. Okwuibe
Quantitative Energy Systems Expert | Electricity Market & BESS
Dr. Godwin Okwuibe is a quantitative energy system expert specializing in electricity markets, battery storage optimization, and flexibility market design. His work focusses on translating complex market dynamics into actionable insights for industry stakehold...