
 Dr. G. O. C. Okwuibe
When Renewables Outran Demand — Week 32, 2026
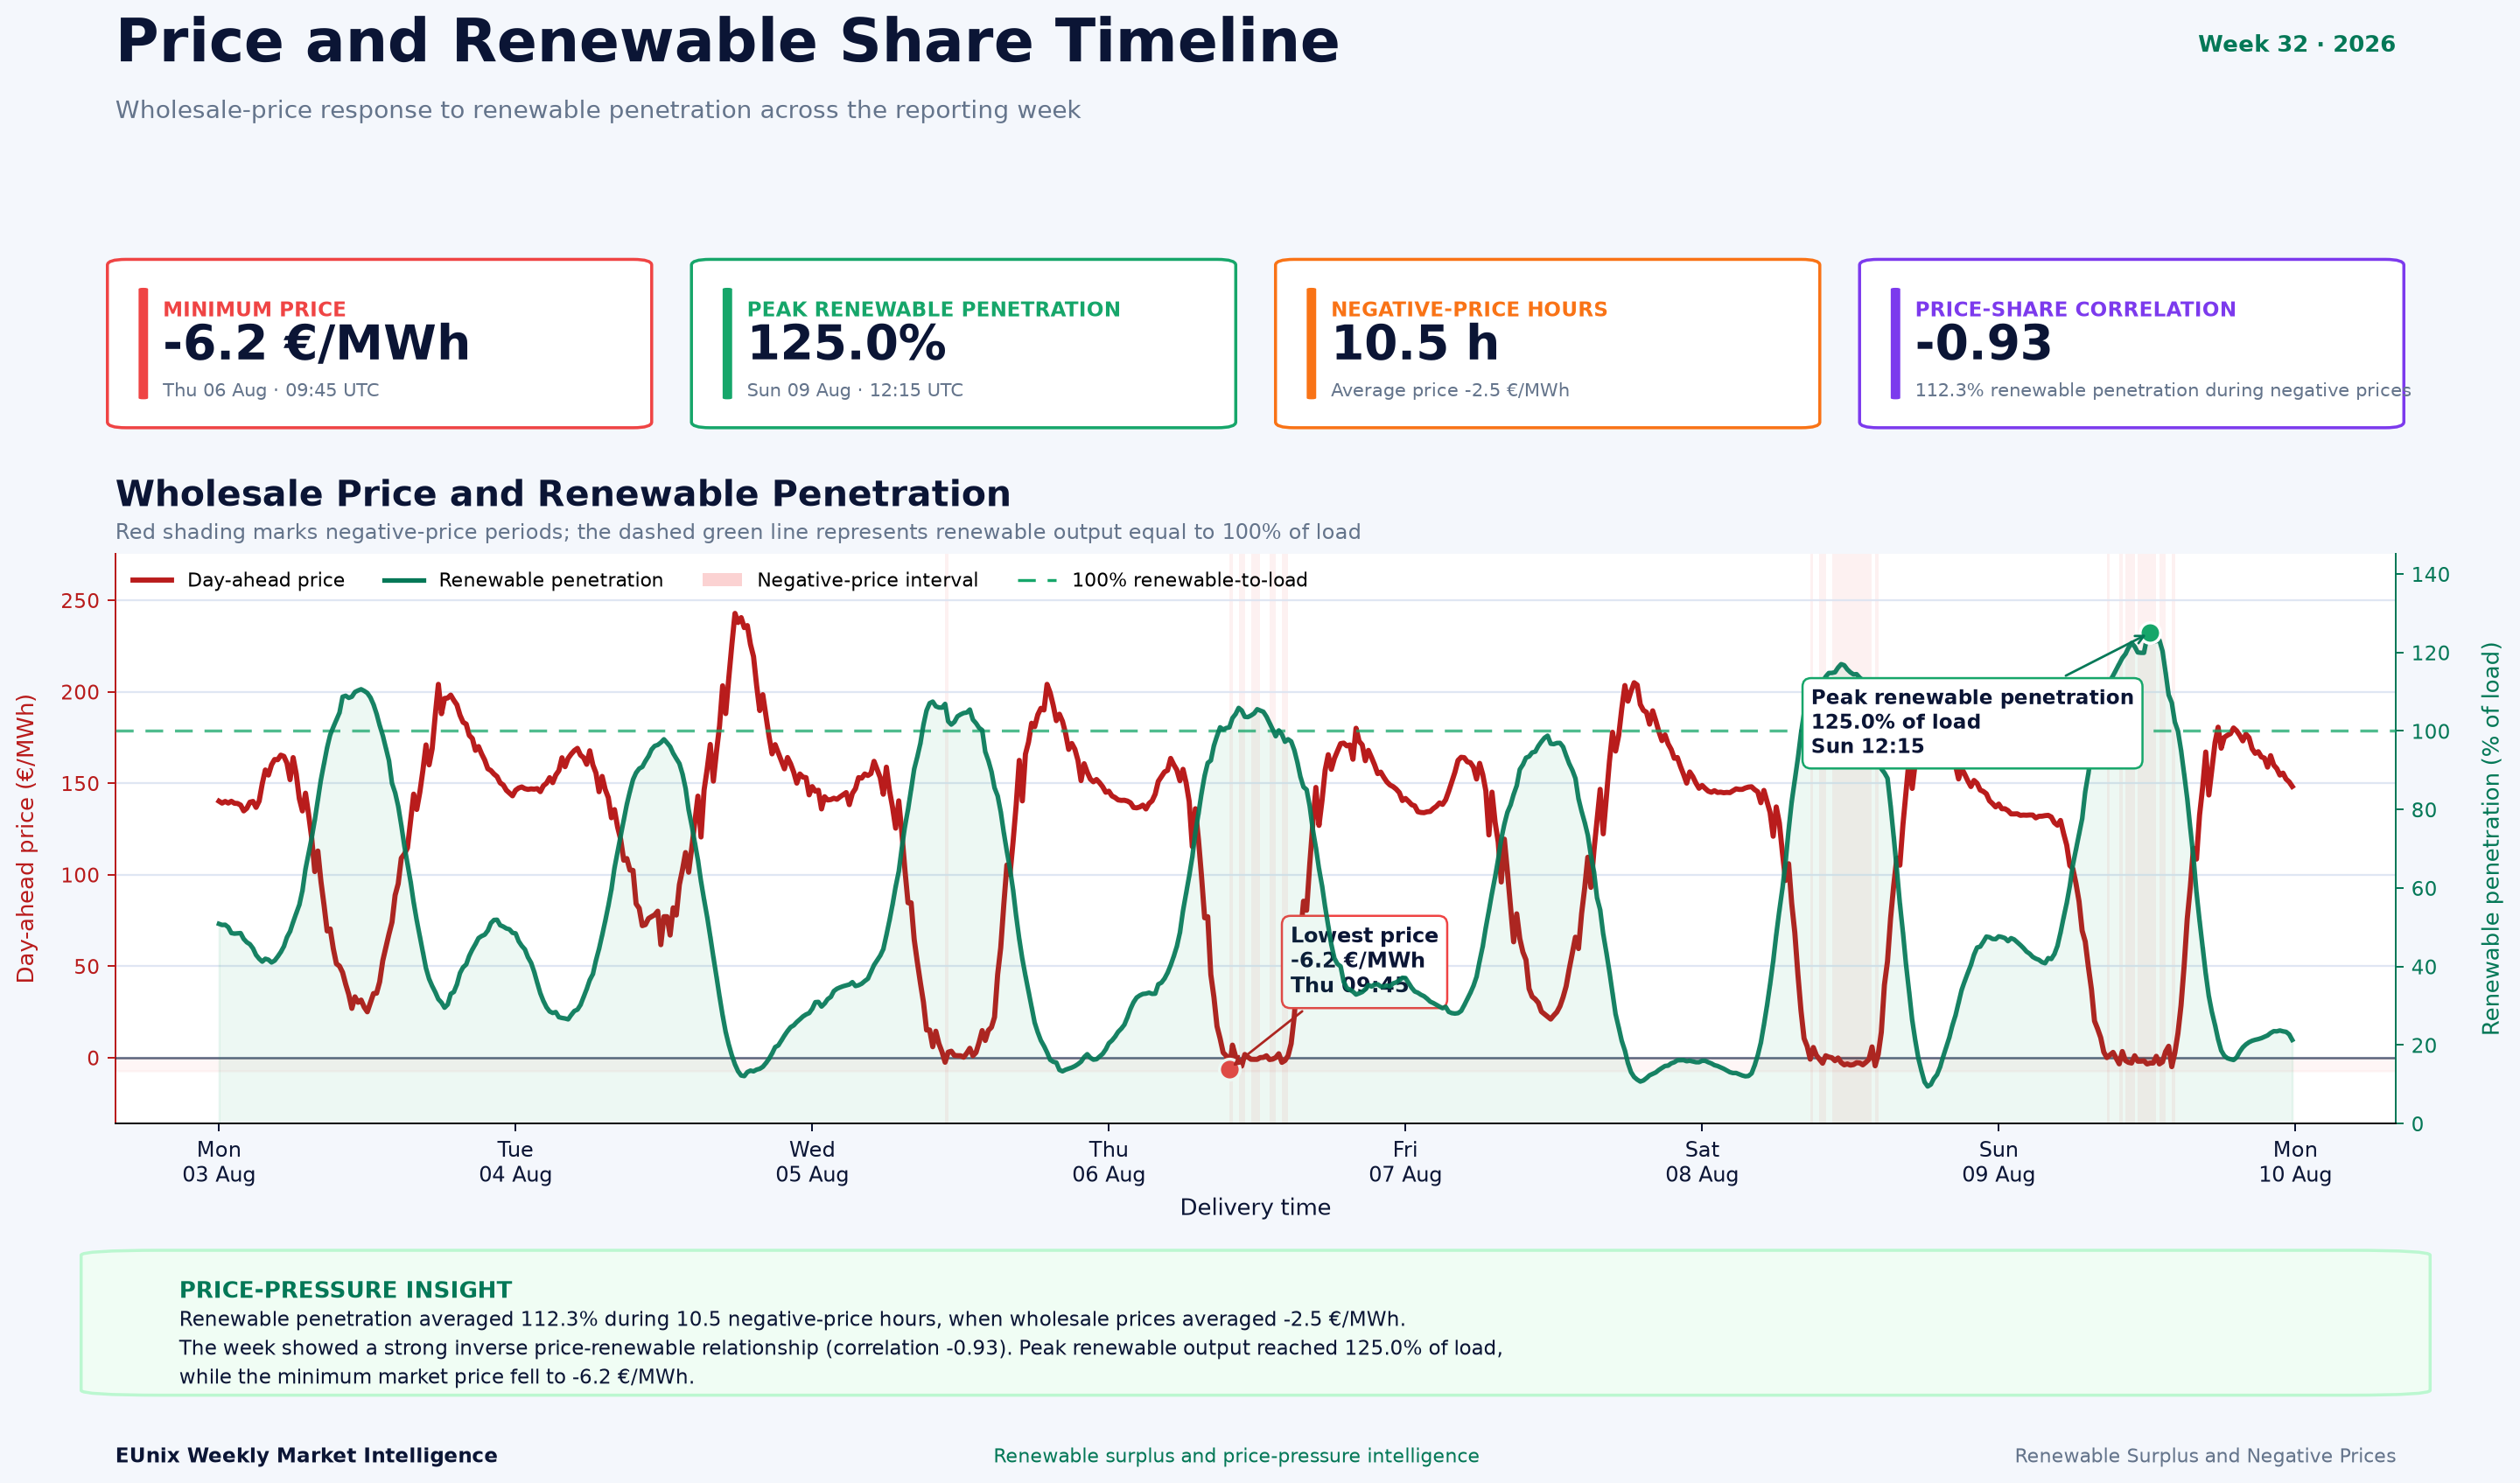
High renewable output became the defining market force in Week 32. Renewable penetration reached 125.0% of load, residual load fell as low as -10.3 GW, and wholesale prices remained negative for 10.5 hours, reaching a weekly minimum of -€6.2/MWh. The relationship was unusually clear: renewable penetration averaged 112.3% during negative-price periods, while the price–renewable-share correlation reached -0.93. EUnix therefore ranked Renewable Surplus and Negative Prices as the week’s leading story, with a priority score of 86.95 and confidence of 76.61%.
Charts
Market Overview
The resulting pressure was visible in both prices and residual load. The minimum residual load reached -10.3 GW, while negative prices persisted for 10.5 hours during the week. The lowest observed wholesale price was -€6.2/MWh, recorded on Thursday, 6 August at 09:45.
The relationship between renewable penetration and prices was particularly strong. The EUnix analysis calculated a -0.93 correlation between renewable share and wholesale prices, meaning the strongest renewable-output periods were closely associated with lower market prices. During negative-price intervals specifically, renewable penetration averaged 112.3% of load, while prices averaged -€2.5/MWh.
The effect was broader than the 10.5 hours of actual negative prices. The platform identified 42 hours of renewable-cannibalization signals, suggesting that downward price pressure extended across a much wider set of high-renewable periods.
From an intelligence perspective, renewable cannibalization was the strongest supporting analytic with an investigation-priority score of 85.19, followed by residual load at 76.22 and negative prices at 68.36. The story itself received a priority score of 86.95, supported by a detection strength of 88.37% and confidence of 76.61%.
Key Observations
Interpretation
The -0.93 correlation is therefore one of the most important signals in this week’s analysis. Prices did not move independently of renewable penetration: higher renewable shares were strongly associated with falling wholesale prices. The periods highlighted in the timeline show renewable output rising toward or beyond the 100% load threshold while day-ahead prices simultaneously moved toward zero and, in several intervals, below it.
The -10.3 GW minimum residual load reinforces this interpretation. Negative residual load indicates periods when renewable generation exceeded electricity demand under the residual-load definition used by the analysis. These conditions create a strong requirement for mechanisms capable of absorbing, shifting, exporting or otherwise responding to excess generation.
The difference between 10.5 negative-price hours and 42 cannibalization hours is also significant. Price cannibalization begins before prices actually cross below zero. Renewable producers can therefore experience declining market value across a considerably broader period than the negative-price count alone might suggest.
This is why the story represents more than an isolated negative-price event. Week 32 shows the interaction between renewable penetration, residual-load compression and wholesale-price formation becoming increasingly visible at an intraday level.
Revenue Insight
Market Outlook
The 100% renewable-to-load level is particularly useful as an operational signal. The supplied timeline shows that price weakness intensified as renewable penetration approached and exceeded this threshold, making the interaction between renewable output and residual demand an important short-term market indicator.
The distinction between ordinary high-renewable periods, cannibalization periods and outright negative prices should also remain important. A market does not need to reach negative prices before renewable revenues begin to deteriorate; Week 32 recorded four times as many cannibalization hours as negative-price hours.
For flexibility operators, the corresponding opportunity is increasingly temporal. The relevant question is not merely how much renewable generation enters the system during a week, but when renewable penetration exceeds demand and how rapidly the market can shift consumption toward those periods.
Week 32 therefore points toward a market in which the value of flexibility increasingly depends on responding precisely to renewable-surplus windows rather than simply reacting to high or low average weekly prices.
Simulation Note
Written by
Dr. G. O. C. Okwuibe
Quantitative Energy Systems Expert | Electricity Market & BESS
Dr. Godwin Okwuibe is a quantitative energy system expert specializing in electricity markets, battery storage optimization, and flexibility market design. His work focusses on translating complex market dynamics into actionable insights for industry stakehold...