
 Dr. G. O. C. Okwuibe
When Schedules and Physical Flows Pulled Apart — Week 21, 2026
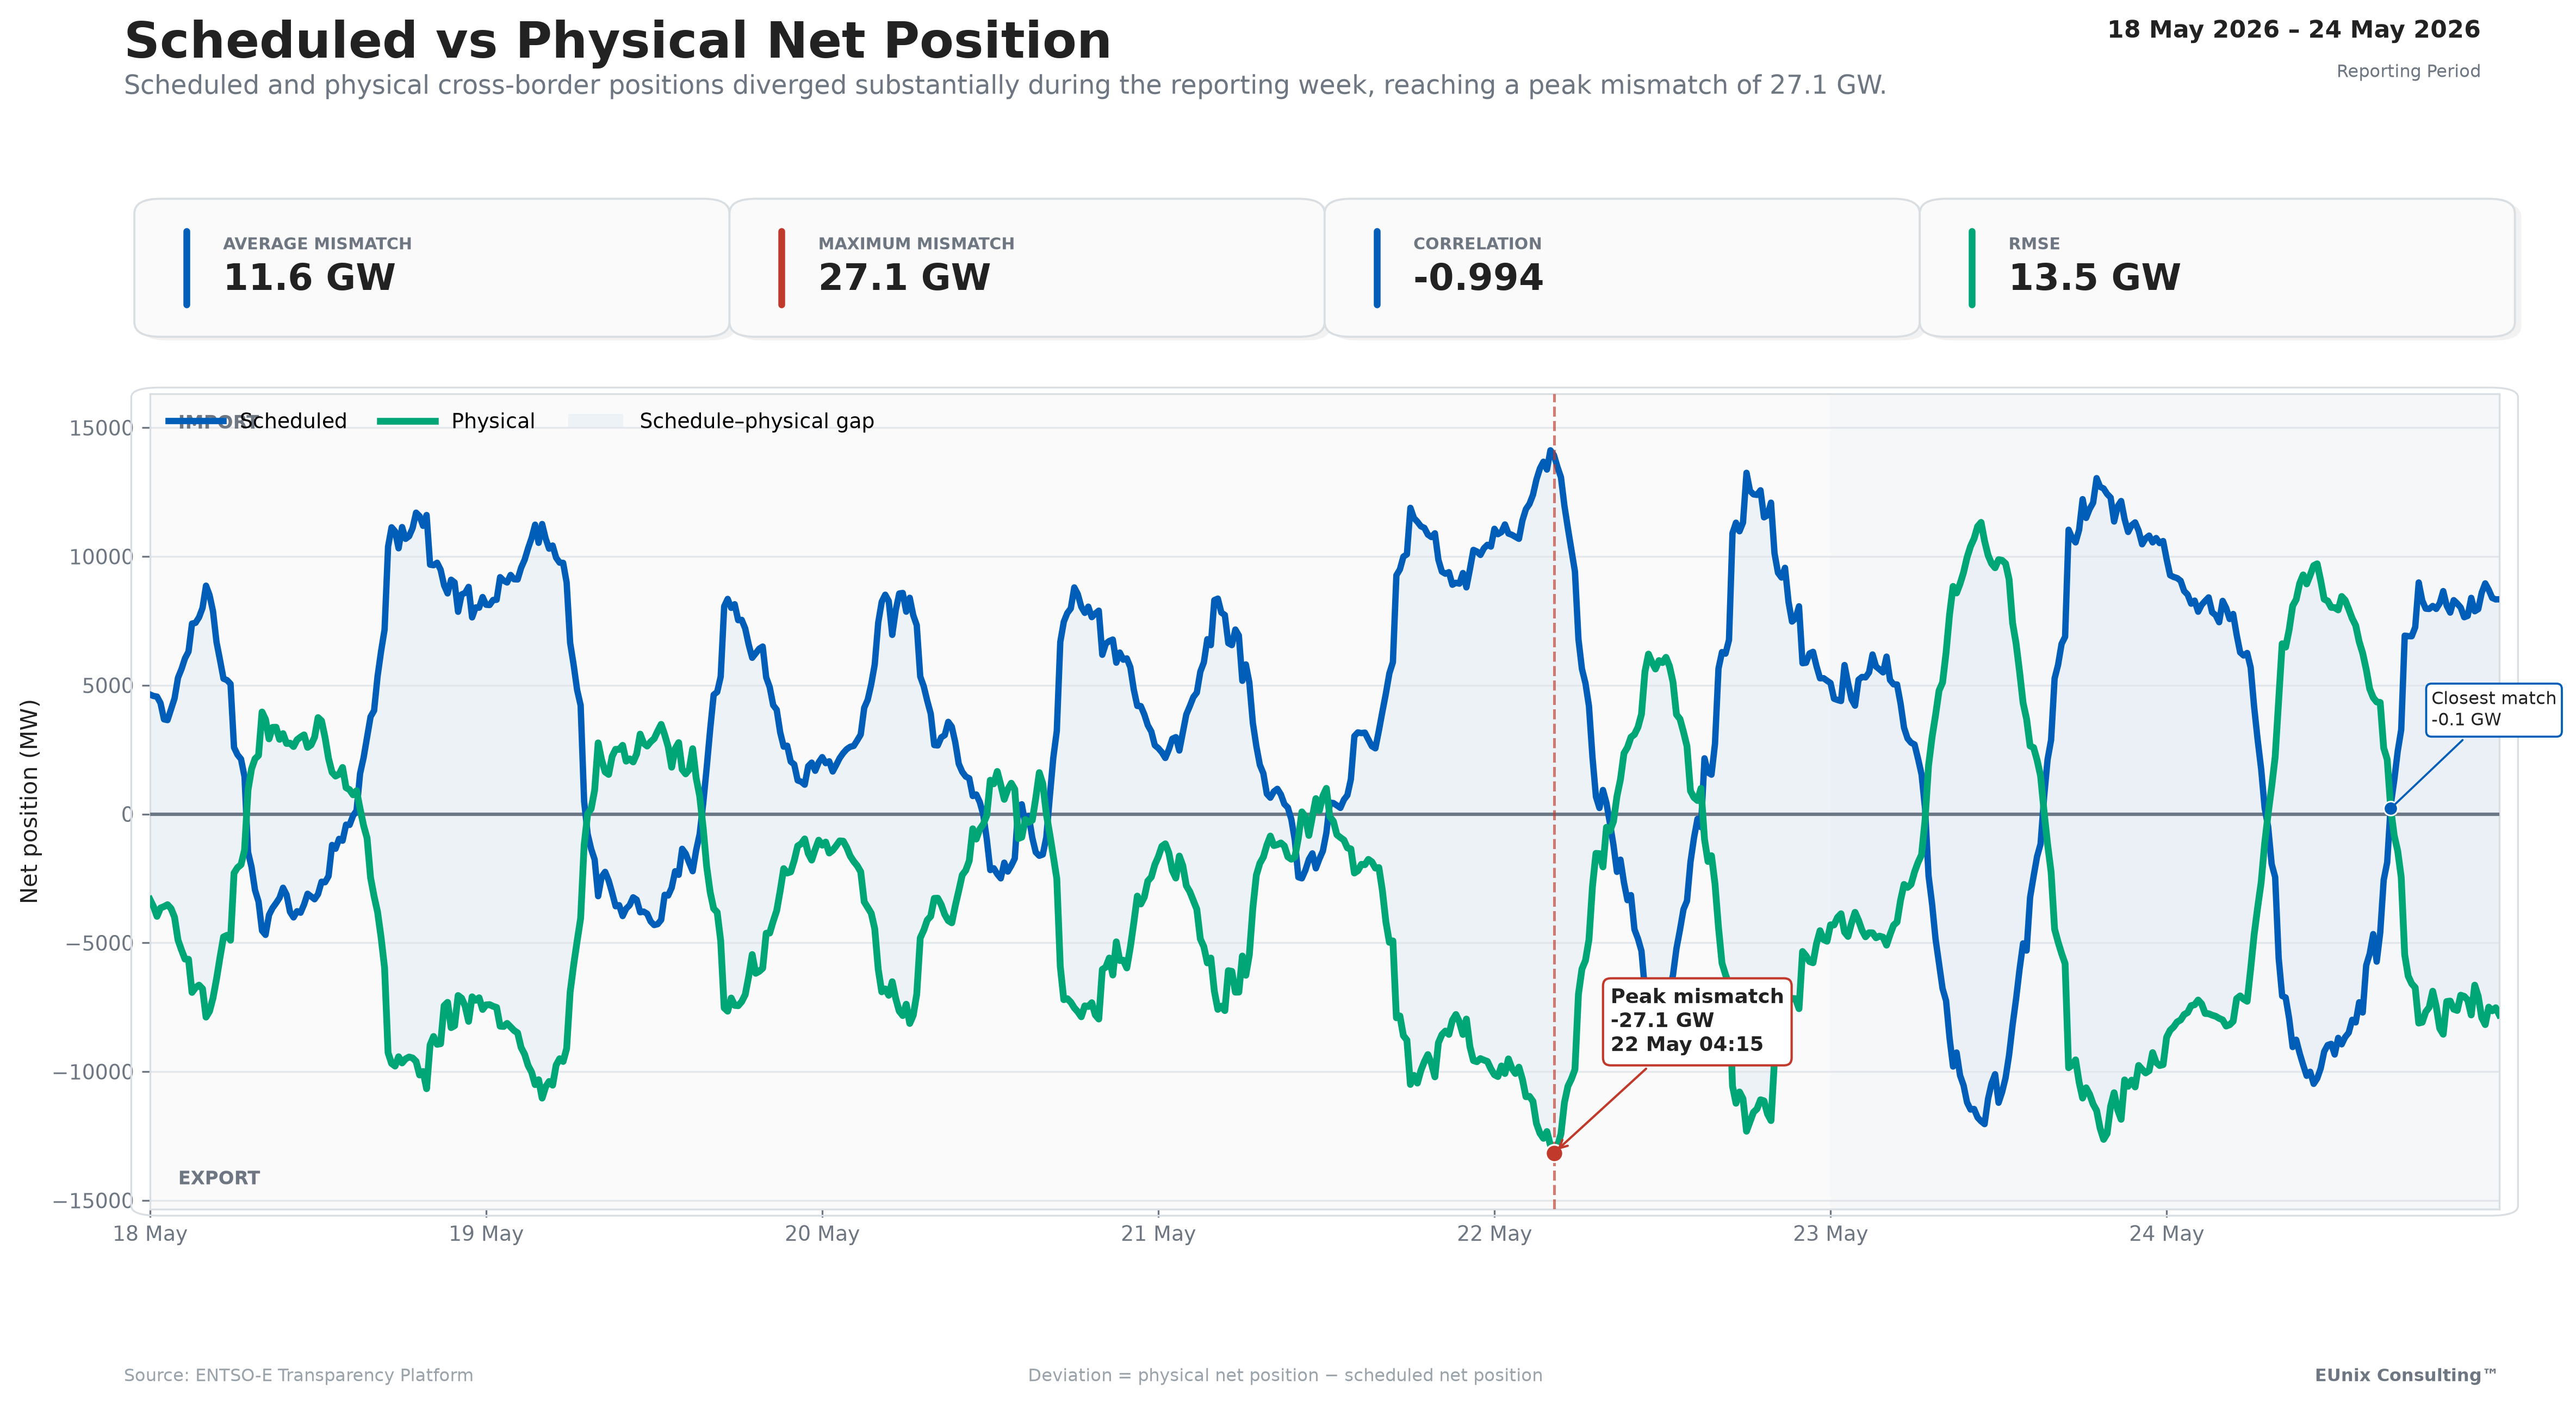
Germany’s scheduled and physical cross-border positions diverged sharply in Week 21, with the maximum mismatch reaching 27.1 GW. Average absolute deviation was 11.6 GW, while all 672 monitored intervals exceeded the 100 MW threshold. A -0.994 correlation showed scheduled and physical positions frequently moving in opposite directions, highlighting persistent divergence between commercial schedules and realised system flows.
Charts
Market Overview
The story received a priority score of 82.49, supported by 88.44% detection strength and 68.37% confidence.
The defining event was a maximum physical–schedule deviation of approximately 27,094.6 MW, recorded on Friday, 22 May at 04:15 UTC. At that point, the physical position was dramatically below the corresponding scheduled position.
The detailed charts report an average absolute interval deviation of approximately 11.6 GW, with an RMSE of 13.5 GW. Operational alignment was assessed at 0.0%, classified as poor, because all 672 monitored intervals exceeded the 100 MW deviation threshold.
The overall signed deviation was approximately -6.9 GW, indicating that physical net positions tended to sit below scheduled positions over the week.
The supporting analytics were led by schedule_deviation at 89.48, followed by scheduled_net_position at 63.63 and border_balancing at 30.87.
Key Observations
Interpretation
A schedule represents the commercial position anticipated through market processes. Physical flows, however, reflect what ultimately moves through the interconnected electricity system subject to network physics, system conditions and cross-border interactions.
Some difference between these quantities is therefore expected.
What makes Week 21 unusual in the supplied data is the scale.
An average absolute mismatch of around 11.6 GW is already substantial. A peak deviation above 27 GW, coupled with a 0.0% operational-alignment assessment, indicates that the scheduled and realised positions behaved as distinctly different signals during the week.
The -0.994 correlation is especially important. Rather than simply showing noisy deviations around a common trajectory, the chart indicates that scheduled and physical positions frequently moved in opposing directions.
This is also visible in the main net-position chart. When the scheduled series moves strongly positive, the physical series is frequently negative, and vice versa. The mismatch therefore reflects more than occasional timing errors or small forecasting differences.
However, the balancing-gap analysis introduces an important qualification.
The relationship between schedule deviation and the measured border-balancing gap is weak, with r = -0.34 and R² = 0.12. Large schedule deviations therefore did not consistently correspond to proportionally large balancing gaps according to the supplied metric.
That makes it inappropriate to interpret every schedule–physical difference as direct balancing-system stress.
Instead, the Week 21 story is fundamentally about operational divergence between commercial schedules and realised cross-border system positioning.
Revenue Insight
Market Outlook
Several indicators would be particularly important to monitor in subsequent weeks: average absolute deviation, maximum deviation, directional bias, duration of persistent mismatch events, operational alignment and the relationship between system-level deviations and individual border contributions.
The directional pattern also deserves attention.
With approximately 73.2% of hourly cells showing negative deviation, Week 21 was clearly asymmetric. A continuation of that bias would suggest something structurally different from randomly distributed forecasting error.
France should also remain under observation because it was identified as the largest contributing border, with approximately 3.27 GW average absolute mismatch.
At the same time, the weak connection between schedule deviation and border-balancing gap should not be ignored. If future weeks continue to show large schedule mismatches without correspondingly strong balancing-gap relationships, the evidence would increasingly support the interpretation that commercial schedules and physical cross-border positions are measuring fundamentally different system dynamics rather than one simply being an inaccurate version of the other.
For Week 21, the market signal is clear: the schedule said one thing, while the physical system repeatedly did something very different.
Simulation Note
Written by
Dr. G. O. C. Okwuibe
Quantitative Energy Systems Expert | Electricity Market & BESS
Dr. Godwin Okwuibe is a quantitative energy system expert specializing in electricity markets, battery storage optimization, and flexibility market design. His work focusses on translating complex market dynamics into actionable insights for industry stakehold...