
 Dr. G. O. C. Okwuibe
When Solar Abundance Becomes a Flexibility Challenge — Week 40, 2026
Week 40 exposed the operational challenge behind high renewable integration: electricity was abundant during the middle of the day, but the system then had to recover rapidly as residual load climbed. The EUnix Intelligence Platform ranked Duck Curve and Flexibility Stress as the week’s #1 intelligence story with a 87.27/100 priority score, 94.96 detection strength and 77.89% confidence. Residual-load depression reached 45.0 GW, while 68 critical ramp intervals highlighted the growing value of storage, demand response and other fast-ramping flexibility.
Charts
Market Overview
Across the week, residual-load troughs occurred at approximately 11:00 on average. The analytical story detector measured the maximum duck-curve depth at approximately 45.0 GW, while the detailed daily profile analysis identified Tuesday, 29 September as the deepest individual daily profile at 38.1 GW under its daily depth methodology. The weekly average daily duck depth was 29.3 GW.
The second half of the duck curve was equally important. Residual load recovered rapidly after the midday trough, with the largest interval-level upward ramp reaching 21.4 GW/h on Wednesday at 15:00. The strongest downward adjustment was 15.5 GW/h on Monday at 07:00, while 68 intervals exceeded the weekly critical-ramp threshold of 9.7 GW/h.
Flexibility stress was not evenly distributed. The hourly heatmap identified Sunday as the most stressed day, with three critical hourly cells, while the greatest concentration of ramping stress occurred around 14:00. At the daily-profile level, Sunday also recorded the largest evening recovery at 44.4 GW.
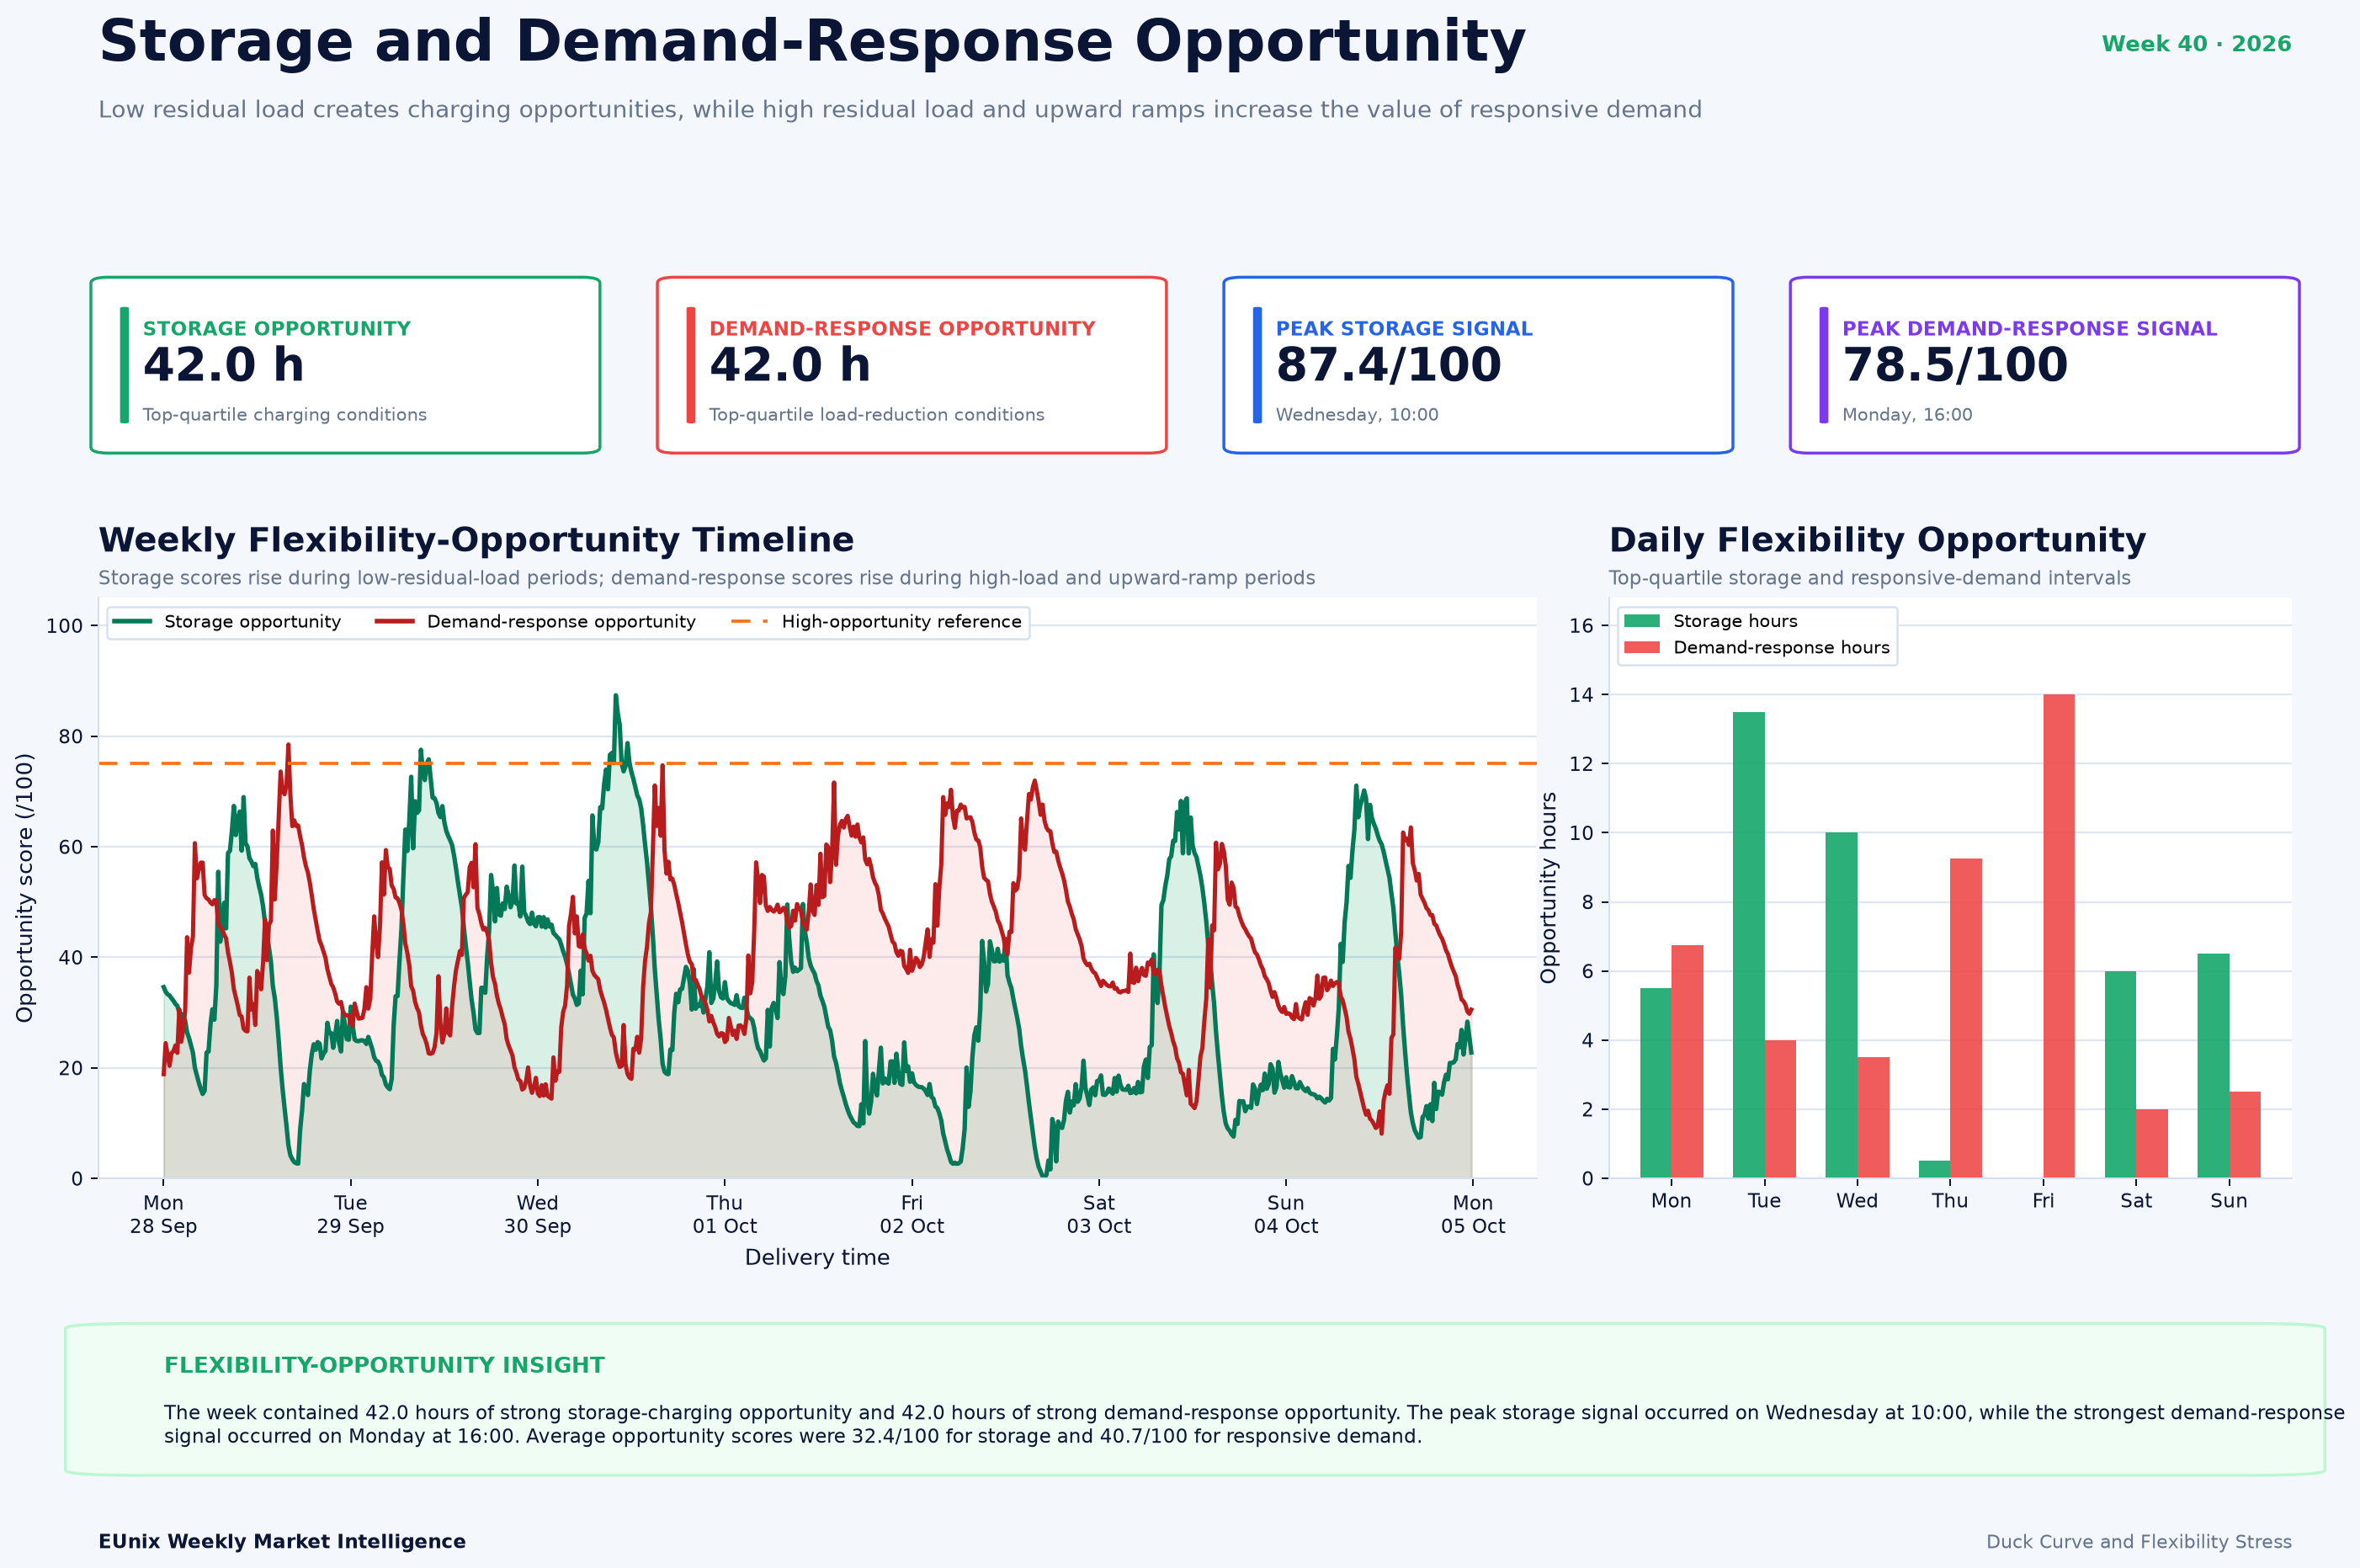
These conditions translated into substantial flexibility potential. The opportunity analysis identified 42.0 hours of top-quartile storage-charging conditions and 42.0 hours of top-quartile demand-response conditions. The strongest storage signal reached 87.4/100 on Wednesday at 10:00, while the strongest demand-response signal reached 78.5/100 on Monday at 16:00.
Key Observations
Interpretation
The average intraday system profile makes this transition particularly clear. Renewable generation rises from roughly 11 GW overnight to above 40 GW around the late morning, pushing average residual load toward its minimum. Later in the day, renewable generation falls sharply while residual load climbs toward approximately 48 GW. The operational challenge is therefore not simply accommodating renewable production but managing the transition between the two conditions.
The 68 critical ramp intervals reinforce this interpretation. Flexibility was required repeatedly throughout the week, while the heatmap reveals a recognizable pattern of downward adjustment during morning hours followed by strong upward requirements in the afternoon. This creates distinct operating windows for different flexibility technologies.
Storage and demand response are therefore complementary rather than interchangeable responses to the Week 40 pattern. Storage can absorb energy during periods of depressed residual load and release it as the system climbs out of the trough. Responsive demand can shift or reduce consumption during periods when residual load and upward-ramping requirements are increasing.
Revenue Insight
Market Outlook
The recurring trough around 11:00 and concentration of critical ramping around the afternoon provide useful reference windows for subsequent weeks. If this intraday structure persists, storage charging, load shifting and other flexible consumption could become increasingly aligned with the midday renewable-output window.
At the same time, Week 40 shows why duck depth should not be considered in isolation. Tuesday produced the deepest daily curve, Wednesday delivered the strongest interval-level upward ramp, and Sunday emerged as the most stressed day in the critical-ramping heatmap. Different metrics therefore reveal different dimensions of flexibility stress.
For subsequent EUnix analysis, 29.3 GW average daily duck depth, 21.4 GW/h maximum upward ramp, 9.7 GW/h critical-ramp threshold and the recurring 11:00 trough provide useful Week 40 benchmarks. Whether these conditions strengthen or weaken in future weeks must be established from subsequent data rather than inferred from Week 40 alone.
Simulation Note
Written by
Dr. G. O. C. Okwuibe
Quantitative Energy Systems Expert | Electricity Market & BESS
Dr. Godwin Okwuibe is a quantitative energy system expert specializing in electricity markets, battery storage optimization, and flexibility market design. His work focusses on translating complex market dynamics into actionable insights for industry stakehold...