
 Dr. G. O. C. Okwuibe
When the Market Dips, Storage Earns: Germany’s Battery Window Widened — Week 31, 2026
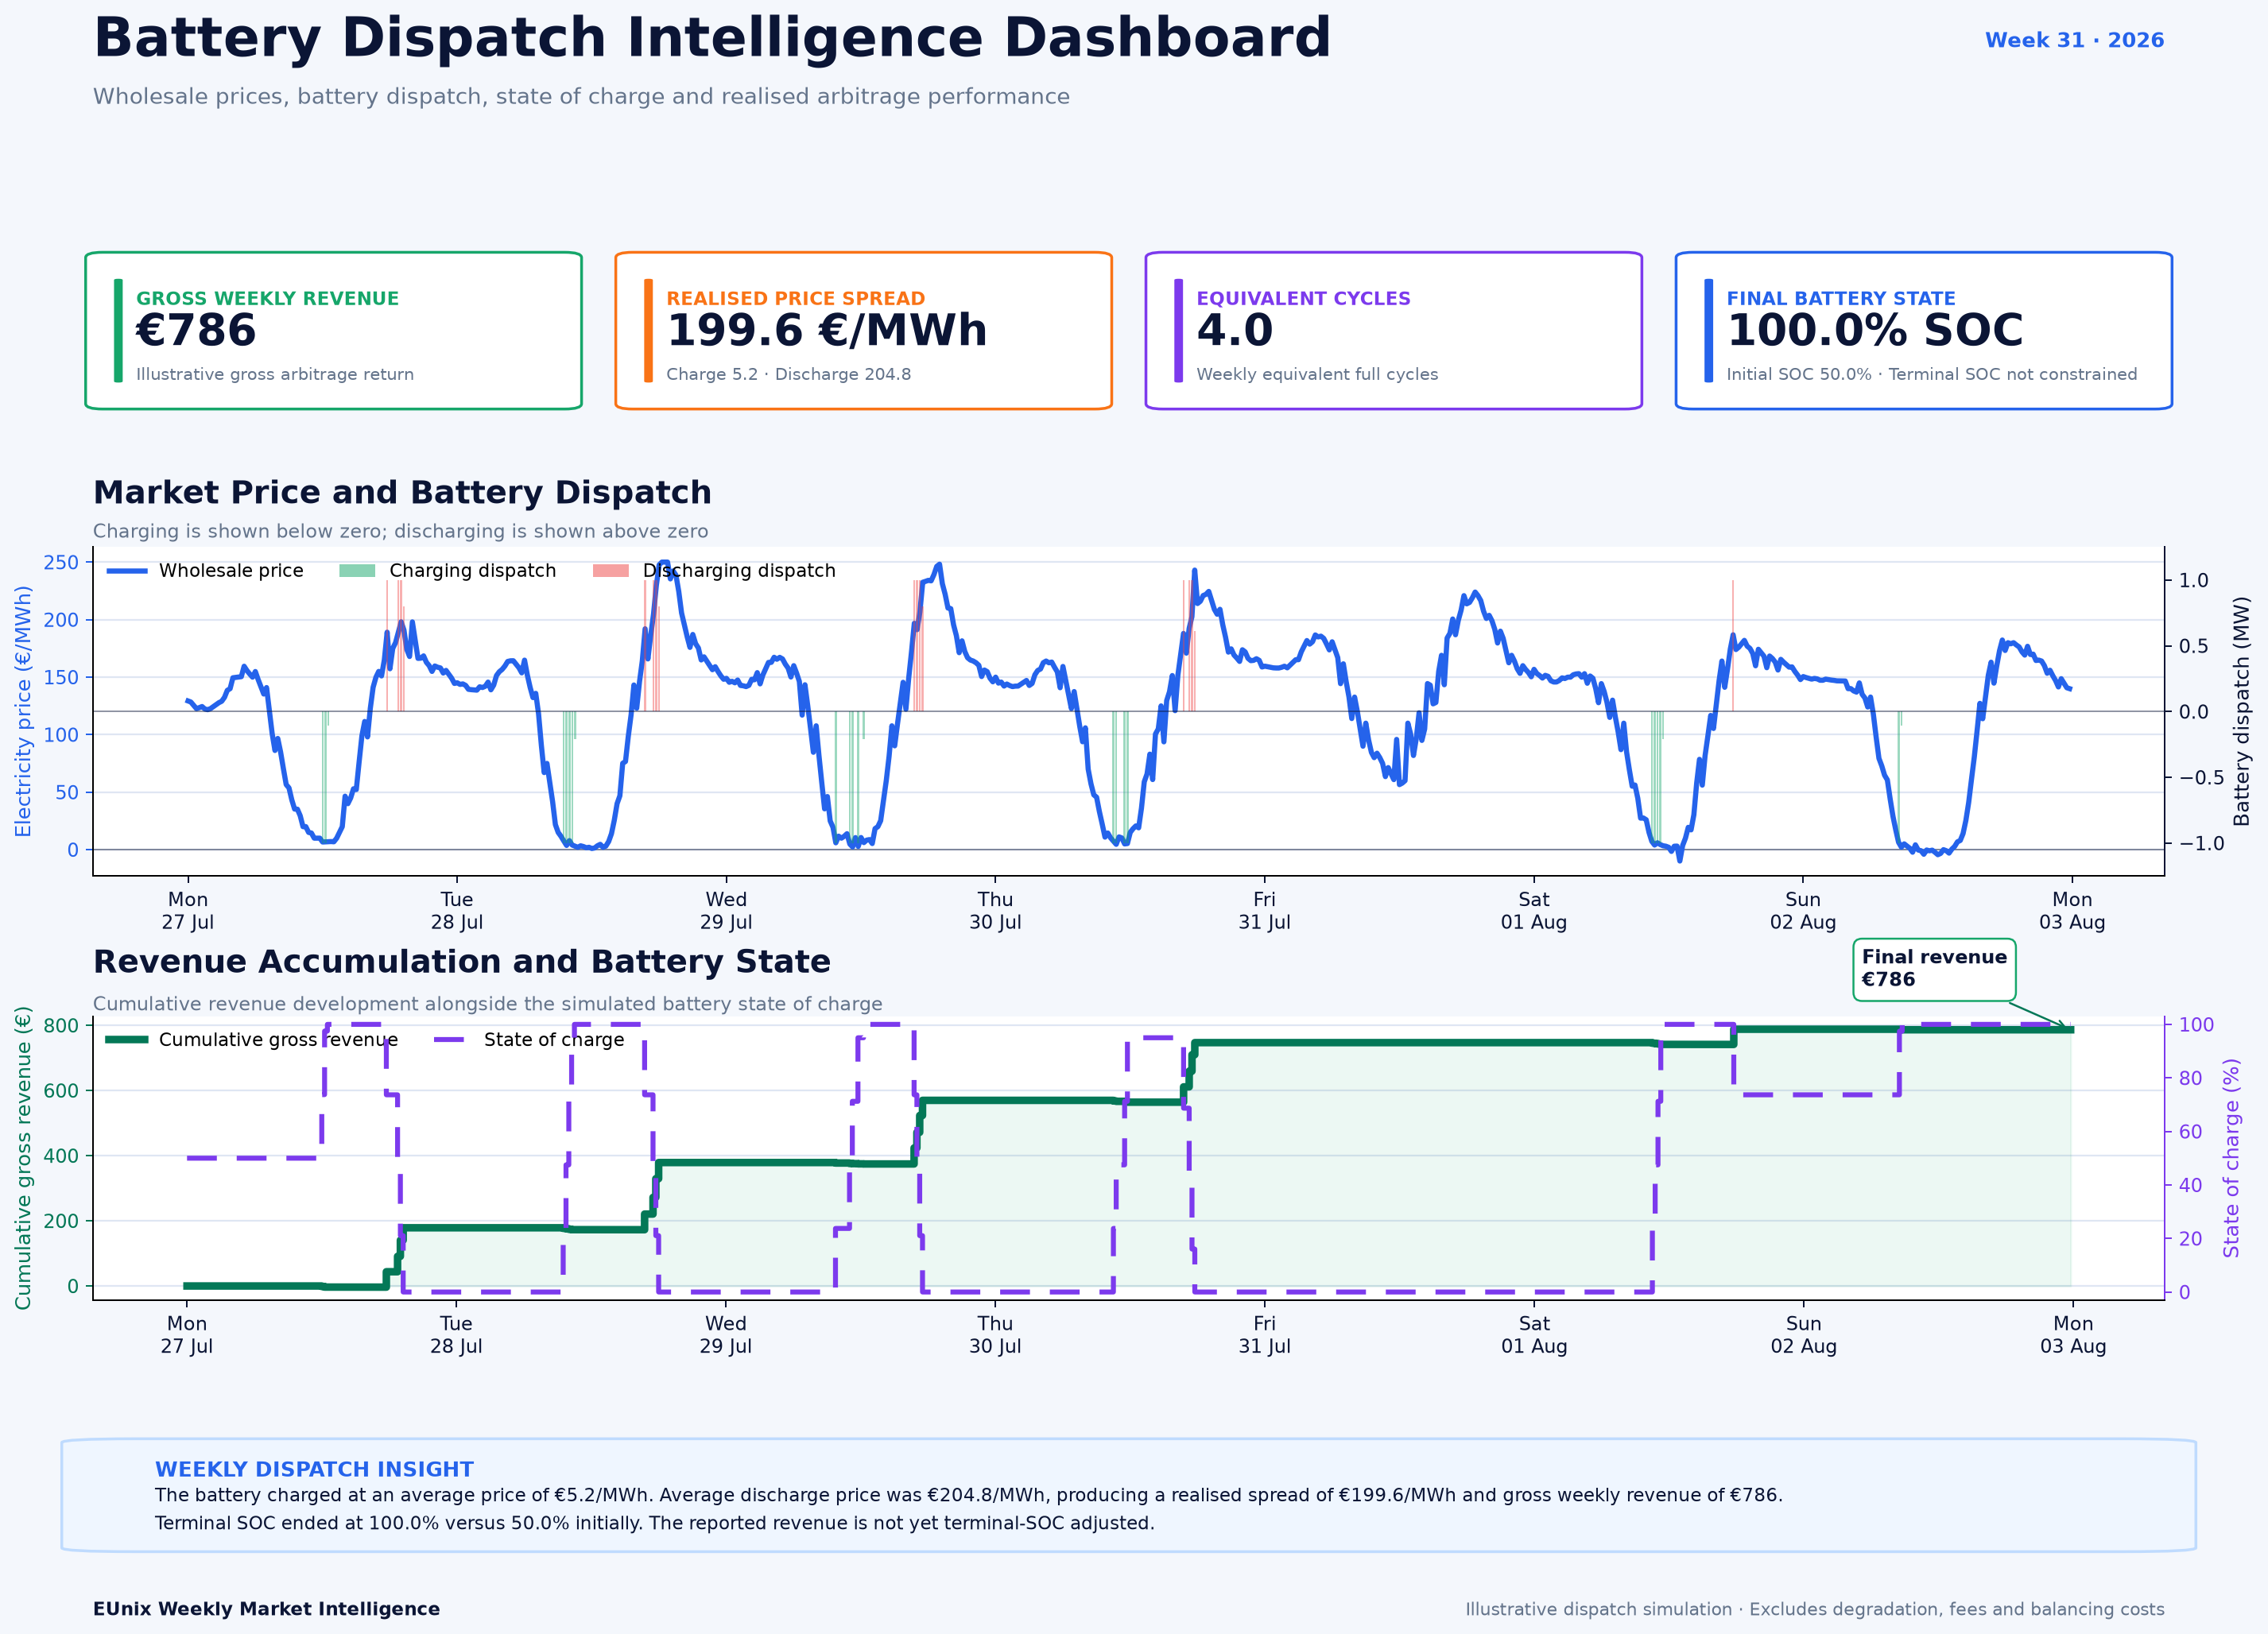
Germany’s Week 31 market offered recurring battery-arbitrage opportunities as daytime prices fell toward zero before recovering sharply in the evening. The maximum daily spread reached €249.0/MWh, with 34 strong opportunity hours. EUnix ranked the story first with an 88.84 priority score. A simulated 1 MW/1 MWh battery generated €786 in gross weekly revenue across 4.0 equivalent cycles.
Charts
Market Overview
This recurring price shape created clearly separated charging and discharging windows. The battery-opportunity timeline shows sustained charging signals between approximately 08:00 and 15:30 on most days, followed by strong discharging signals from roughly 17:00 to 21:30.
The strongest daily charging-to-discharging spread reached €249.0/MWh on Tuesday, while the average daily spread was €210.8/MWh. Even the weakest day, Friday, retained a spread of €167.4/MWh, showing that the arbitrage opportunity was not dependent on a single exceptional event.
The weekly story was supported primarily by the battery_opportunity analytic, which scored 93.37. price_volatility scored 64.37, while negative_price scored 53.58. This indicates that the opportunity arose mainly from the regular intraday separation between low and high prices, rather than from extreme volatility alone.
The simulated 1 MW / 1 MWh battery charged 4.96 MWh, discharged 4.00 MWh, completed 4.0 equivalent cycles, and ended the week at 100% state of charge. The model reported €786.47 net illustrative gross arbitrage revenue before degradation, fees, taxes, and balancing costs.
Key Observations
Interpretation
The price curve suggests that low-price periods were associated with broad midday depressions rather than isolated short-lived price shocks. On several days, prices approached zero for extended periods before rising above €180–250/MWh later in the cycle. That created sufficient time for a short-duration battery to charge before the evening price recovery.
The battery_opportunity score of 93.37 was materially higher than the standalone volatility score of 64.37. This supports the interpretation that Week 31 was primarily a structured arbitrage week rather than simply a volatile week. The value came from repeatable price timing, not only from sudden market movements.
Negative prices contributed to the opportunity, but they were not essential to it. The lowest market price was only moderately negative at -€9.9/MWh, while large spreads persisted throughout the week. The battery could therefore benefit from low positive prices as well as from the relatively limited negative-price intervals.
The story-level maximum spread of €249.04/MWh and the simulation’s realised spread of €199.6/MWh measure different things. The former represents the largest theoretical daily low-to-high price separation, while the latter reflects the average prices actually selected by the simulated dispatch after operational constraints and efficiency losses.
Revenue Insight
Market Outlook
The depth and duration of midday price suppression will be particularly important. Extended periods near zero create more operational room for charging than brief price dips, especially for batteries that must account for forecast error and dispatch timing.
The evening recovery should also be tracked. Week 31 repeatedly produced strong discharge signals from approximately 17:00 onward. A weakening of this recovery would narrow realised spreads even if midday prices remained low.
Operators should distinguish between maximum theoretical spread and achievable dispatch spread. Although the market offered a peak daily spread of €249.0/MWh, the simulated battery realised €199.6/MWh. Efficiency, state-of-charge constraints, timing, and available capacity determine how much of the headline spread can actually be monetised.
Finally, terminal-SOC treatment should be included in any investment or operational comparison. Because the battery finished at 100% SOC, part of the reported weekly value remained stored rather than fully monetised within the reporting period.
Simulation Note
Written by
Dr. G. O. C. Okwuibe
Quantitative Energy Systems Expert | Electricity Market & BESS
Dr. Godwin Okwuibe is a quantitative energy system expert specializing in electricity markets, battery storage optimization, and flexibility market design. His work focusses on translating complex market dynamics into actionable insights for industry stakehold...