
 Dr. G. O. C. Okwuibe
When the Market Moves Faster Than the Forecast — Week 39, 2026
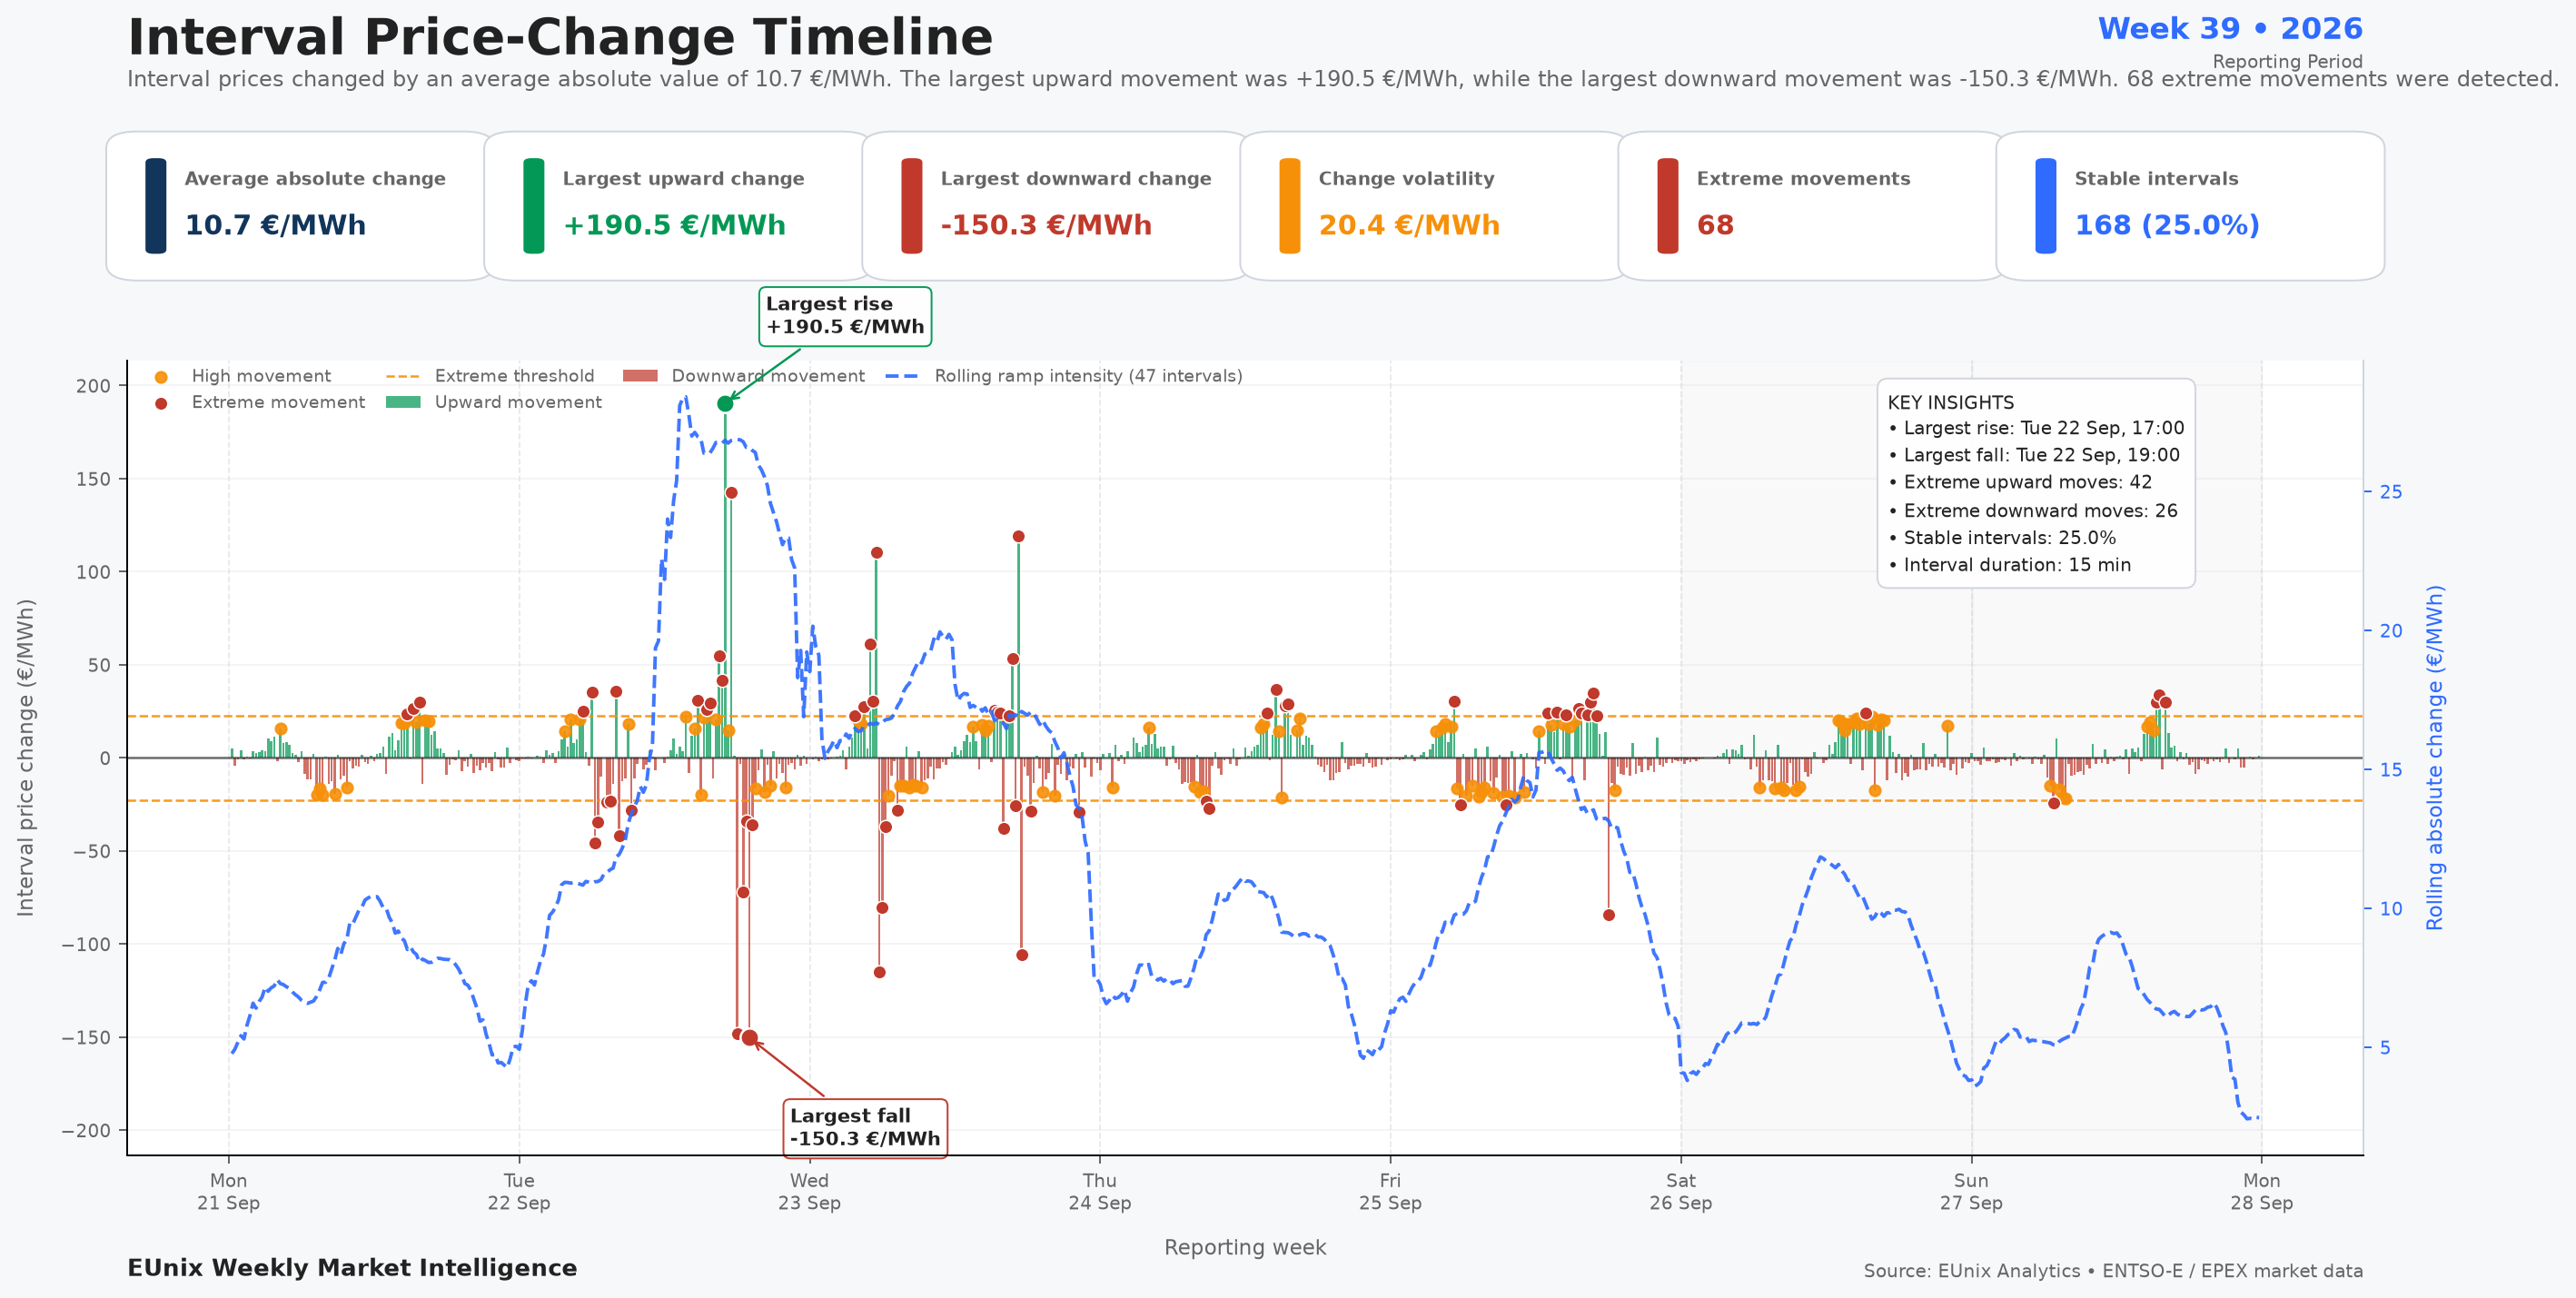
Week 39 was defined by unusually sharp price movements rather than simply high prices. Wholesale electricity ranged from −€5.0/MWh to €734.6/MWh, a €739.6/MWh weekly range, while volatility reached €92.6/MWh. The EUnix Intelligence Platform detected 68 spike intervals and a maximum single-interval movement of €190.5/MWh, making Extreme Market Volatility the week's selected intelligence story with a priority score of 81.68/100.
Charts
Market Overview
Tuesday, 22 September was the defining trading day. The weekly maximum of €734.6/MWh occurred at 17:45, while the largest upward interval movement, +€190.5/MWh, occurred around the same evening escalation. The subsequent reversal was equally important: the largest downward movement reached −€150.3/MWh.
Volatility was not limited to one isolated price peak. The analysis identified 68 spike intervals representing 17.0 hours, alongside 93 crash intervals representing 23.2 hours. Of these events, 34 were classified as extreme spikes and 48 as extreme crashes. The market therefore repeatedly crossed between relatively normal conditions and much more aggressive price regimes.
The distribution also shows a pronounced upper tail. The 95th-percentile threshold was €288.9/MWh, while the 99th percentile reached €496.8/MWh. The distribution had a positive skew of 1.23, confirming that the week's exceptional behaviour was weighted toward large upward price excursions even though brief negative-price conditions also occurred.
Negative prices were comparatively limited, totalling 2.2 hours, with the weekly minimum of −€5.0/MWh occurring on Sunday. The week's dominant feature was therefore not prolonged negative pricing but the speed, magnitude and recurrence of movements across the price curve.
Key Observations
Interpretation
The timing of the volatility is particularly important. The heatmap identifies Tuesday as the most volatile day and around 17:00 as the most volatile hour, while Tuesday's daily spread reached €612.3/MWh. This concentration means market exposure was not evenly distributed across the week: a relatively small number of periods carried a disproportionate share of the week's price risk.
The distribution reinforces that conclusion. With a median of €172.0/MWh, a 95th-percentile threshold of €288.9/MWh and a 99th percentile of €496.8/MWh, the upper tail extended far beyond normal weekly price levels. The positive skew of 1.23 further indicates that exceptional upward movements were an important feature of the week's market structure.
For traders, flexible assets and market participants with open positions, the relevant risk was therefore both price level and ramp speed. A participant could face materially different market conditions within consecutive settlement intervals, making timing, forecasting accuracy and position management increasingly important during the identified extreme windows.
Revenue Insight
Market Outlook
The strongest warning signal is the concentration of risk. Tuesday ranked far above every other day in the daily volatility comparison, with Wednesday a distant second. Such clustering means weekly averages can remain relatively ordinary while individual hours become operationally and financially dominant.
For flexibility operators, the implication is to place greater emphasis on identifying high-volatility windows rather than assuming that opportunity is distributed uniformly throughout the day. For traders, the same evidence supports closer monitoring of ramp intensity and extreme-tail exposure when setting positions and risk limits.
The Week 39 evidence does not establish whether this volatility will persist into Week 40. It does, however, provide a useful benchmark: €92.6/MWh price volatility, €190.5/MWh maximum interval movement and €288.9/MWh as the upper-tail threshold are the key Week 39 reference levels against which subsequent market conditions can be assessed.
Simulation Note
Written by
Dr. G. O. C. Okwuibe
Quantitative Energy Systems Expert | Electricity Market & BESS
Dr. Godwin Okwuibe is a quantitative energy system expert specializing in electricity markets, battery storage optimization, and flexibility market design. His work focusses on translating complex market dynamics into actionable insights for industry stakehold...