
 Dr. G. O. C. Okwuibe
When the Midday Trough Deepened and the Evening Ramp Took Over — Week 22, 2026
Germany’s power system displayed a pronounced flexibility pattern during ISO Week 22. The EUnix analysis identified a deep midday residual-load depression, recurring critical ramping intervals and strong evening recovery requirements. The story scored 89.26, with 95.85% detection strength and 82.31% confidence, highlighting a week in which renewable-driven midday conditions increased the value of flexible demand, storage and fast-ramping resources.
Charts
Market Overview
The story received a priority score of 89.26, supported by 95.85% detection strength and 82.31% confidence, and was classified as Critical.
At story level, the strongest signal was a maximum duck depth of 55.3 GW, alongside a maximum evening ramp of 40.0 GW and 68 critical residual-ramp intervals. The supporting analytics were led almost equally by demand_response_opportunity at 93.10 and duck_curve at 93.07, followed by ramping at 77.55 and storage_utilization at 62.54.
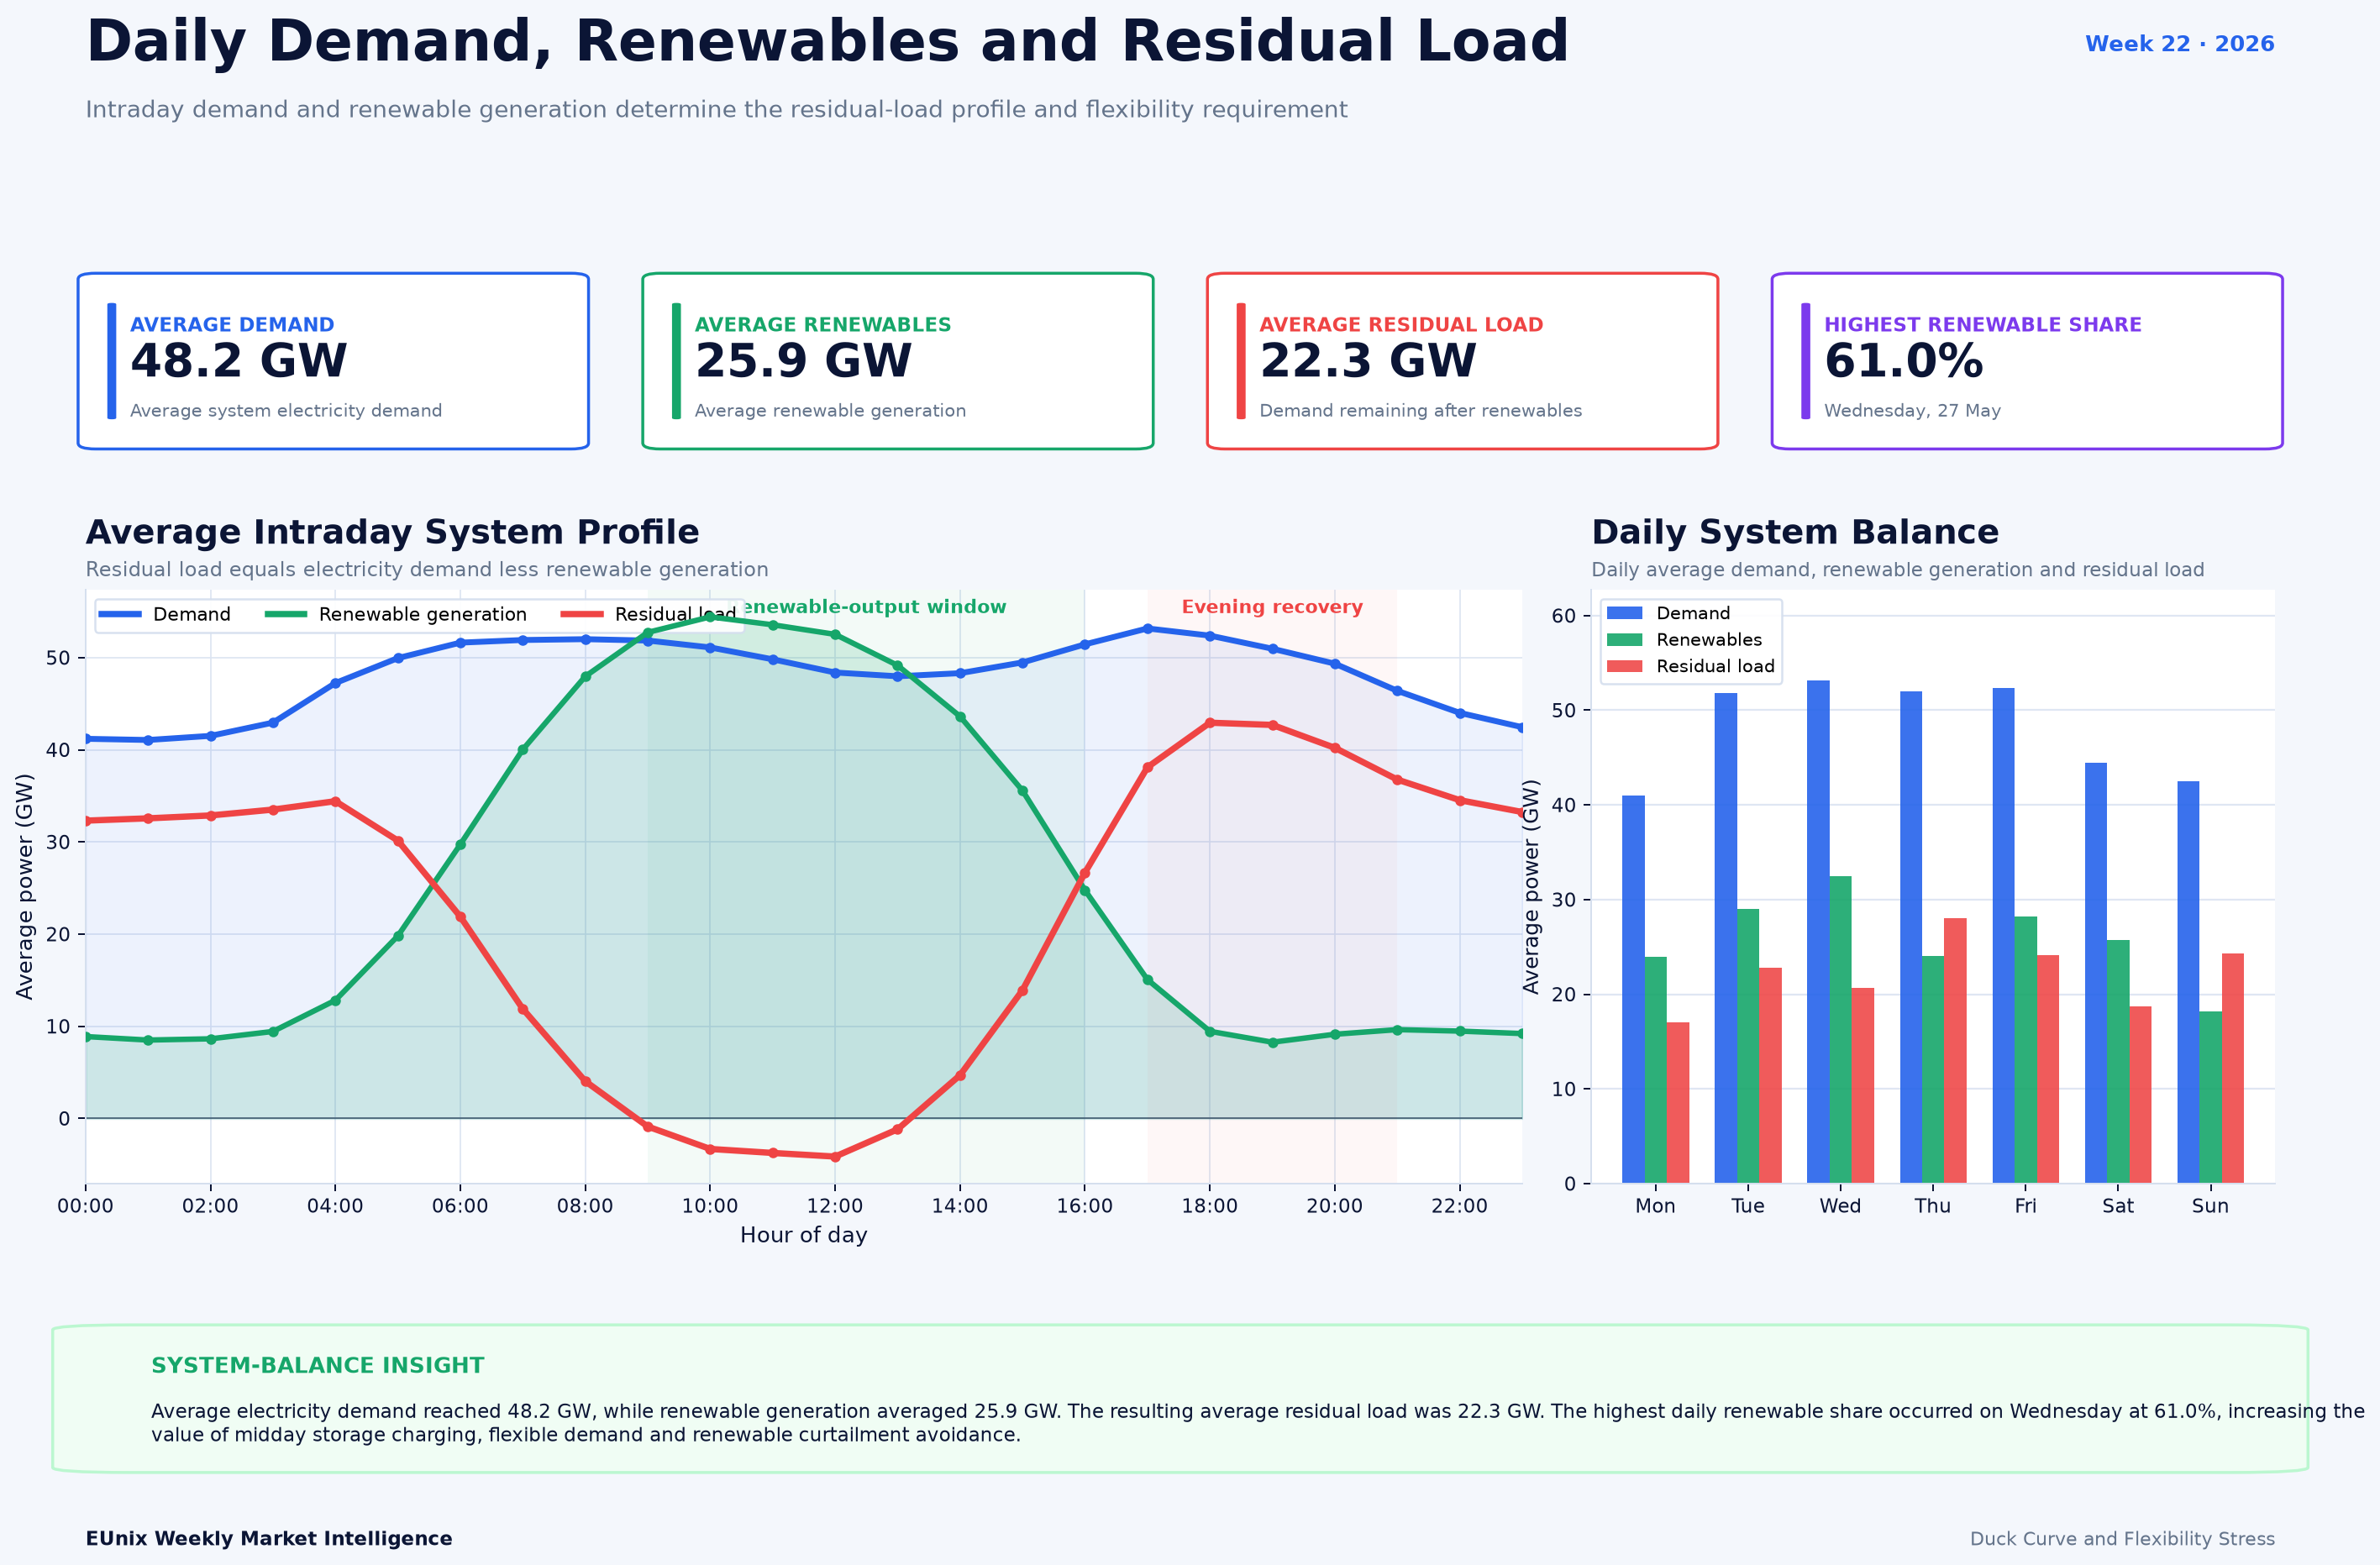
The underlying system profile explains why the flexibility signal was so strong. Average electricity demand was 48.2 GW, while renewable generation averaged 25.9 GW, leaving average residual load of 22.3 GW. Renewable output became especially influential around the middle of the day, with the average residual-load profile falling below zero during the late-morning and midday period before rising sharply into the evening.
The detailed daily-profile visualisation reports a minimum residual load of -13.6 GW, with the typical daily trough occurring around 11:00. It also identifies Monday, 25 May as the deepest daily duck-curve profile at 46.8 GW and Thursday, 28 May as having the strongest daily evening recovery at 54.6 GW.
There is an important metric-definition difference within the supplied charts: the story-level summary reports maximum duck depth of 55.3 GW and maximum evening ramp of 40.0 GW, while the dedicated daily-profile charts show 46.8 GW for the deepest daily duck curve and 54.6 GW for the largest evening recovery. These should therefore be treated as related but differently calculated indicators rather than interchangeable values.
Key Observations
Interpretation
Electricity demand remained comparatively stable through much of the daytime, but renewable generation increased rapidly through the morning and reached its highest levels around the middle of the day. Residual load therefore collapsed precisely when renewable availability was strongest.
The system then had to reverse direction.
As renewable output fell during the afternoon while electricity demand remained relatively elevated, residual load increased rapidly toward the evening. This creates the characteristic second half of the duck curve: the system moves from conditions of potential excess renewable electricity to a requirement for substantial upward flexibility within only a few hours.
The timing shown in the charts is particularly important.
Daily troughs occurred around 11:00 on average, while the most concentrated ramping stress appeared around 16:00. The flexibility challenge therefore contains two operational windows rather than one.
The first is the midday absorption problem: sufficient flexible demand, storage charging or other controllable consumption is required when residual load becomes very low or negative.
The second is the afternoon-to-evening recovery problem: flexible supply or demand reduction must become available as renewable contribution declines and residual load rises again.
This explains why both duck_curve and demand_response_opportunity received analytical scores above 93. Storage can absorb part of the low-residual-load period, while responsive demand can reduce system pressure during the subsequent recovery.
The supplied data also show that flexibility requirements cannot be understood from the deepest trough alone. Monday produced the deepest daily curve, but Thursday recorded the largest evening recovery. Different days therefore created different types of system stress.
That distinction matters operationally. A deep trough primarily indicates the need to absorb or shift energy. A steep upward ramp is predominantly a power and response-speed problem.
Week 22 contained both.
Revenue Insight
Market Outlook
Several indicators from Week 22 provide useful reference points: the story-level 55.3 GW maximum duck-depth signal, daily duck depths averaging 39.8 GW, the -13.6 GW minimum residual load, 68 critical ramp intervals, and the concentration of ramping stress around 16:00.
The consistency of the daily profile is particularly important.
Every day displayed a recognisable midday depression followed by evening recovery, although the magnitude varied significantly. Continued repetition would indicate that flexibility requirements are becoming structurally embedded in the daily operating pattern rather than being driven by occasional extreme days.
The balance between the two sides of the curve should also be watched closely.
Deeper residual-load troughs would strengthen the need for storage charging and demand shifting, while faster afternoon recovery would increase the requirement for dispatchable generation, battery discharge and responsive demand.
The Week 22 charts suggest that these requirements can occur almost sequentially: absorb electricity during the middle of the day, then provide upward flexibility only a few hours later.
For Week 22, the market signal is therefore not simply that Germany experienced another duck curve. It is that the distance between the midday trough and the evening system requirement became large enough, frequent enough and fast enough to turn flexibility itself into the central market story.
Simulation Note
Written by
Dr. G. O. C. Okwuibe
Quantitative Energy Systems Expert | Electricity Market & BESS
Dr. Godwin Okwuibe is a quantitative energy system expert specializing in electricity markets, battery storage optimization, and flexibility market design. His work focusses on translating complex market dynamics into actionable insights for industry stakehold...